

Charts & Chit Chat: 14 Charts For The Financial Heart
Charts & Chit Chat: 14 Charts For The Financial Heart
Charts And Financial Frameworks Read Quickly

Here at Simply Finance we give you a high level of Financial Data alongside relatable stories to make sure learning about Finance isn’t so dry.
Let’s put some personality back in Finance.
Don’t be shy to hit the “like” button, share this post, and become a subscriber to this entirely FREE NEWSLETTER if you haven’t done so already!
Today’s edition is part of Charts & Chit Chat where I share Financial Data/Charts alongside quick takeaways that get right to the point.
Another edition of My Stories will be next and released within the next few days. That’s a long forum post where I share vulnerable thoughts around my opinions in Finance.
For now, let’s look at some data and get right to the point.
Below is a recap of my favorite Finance visuals and notes over the last week.
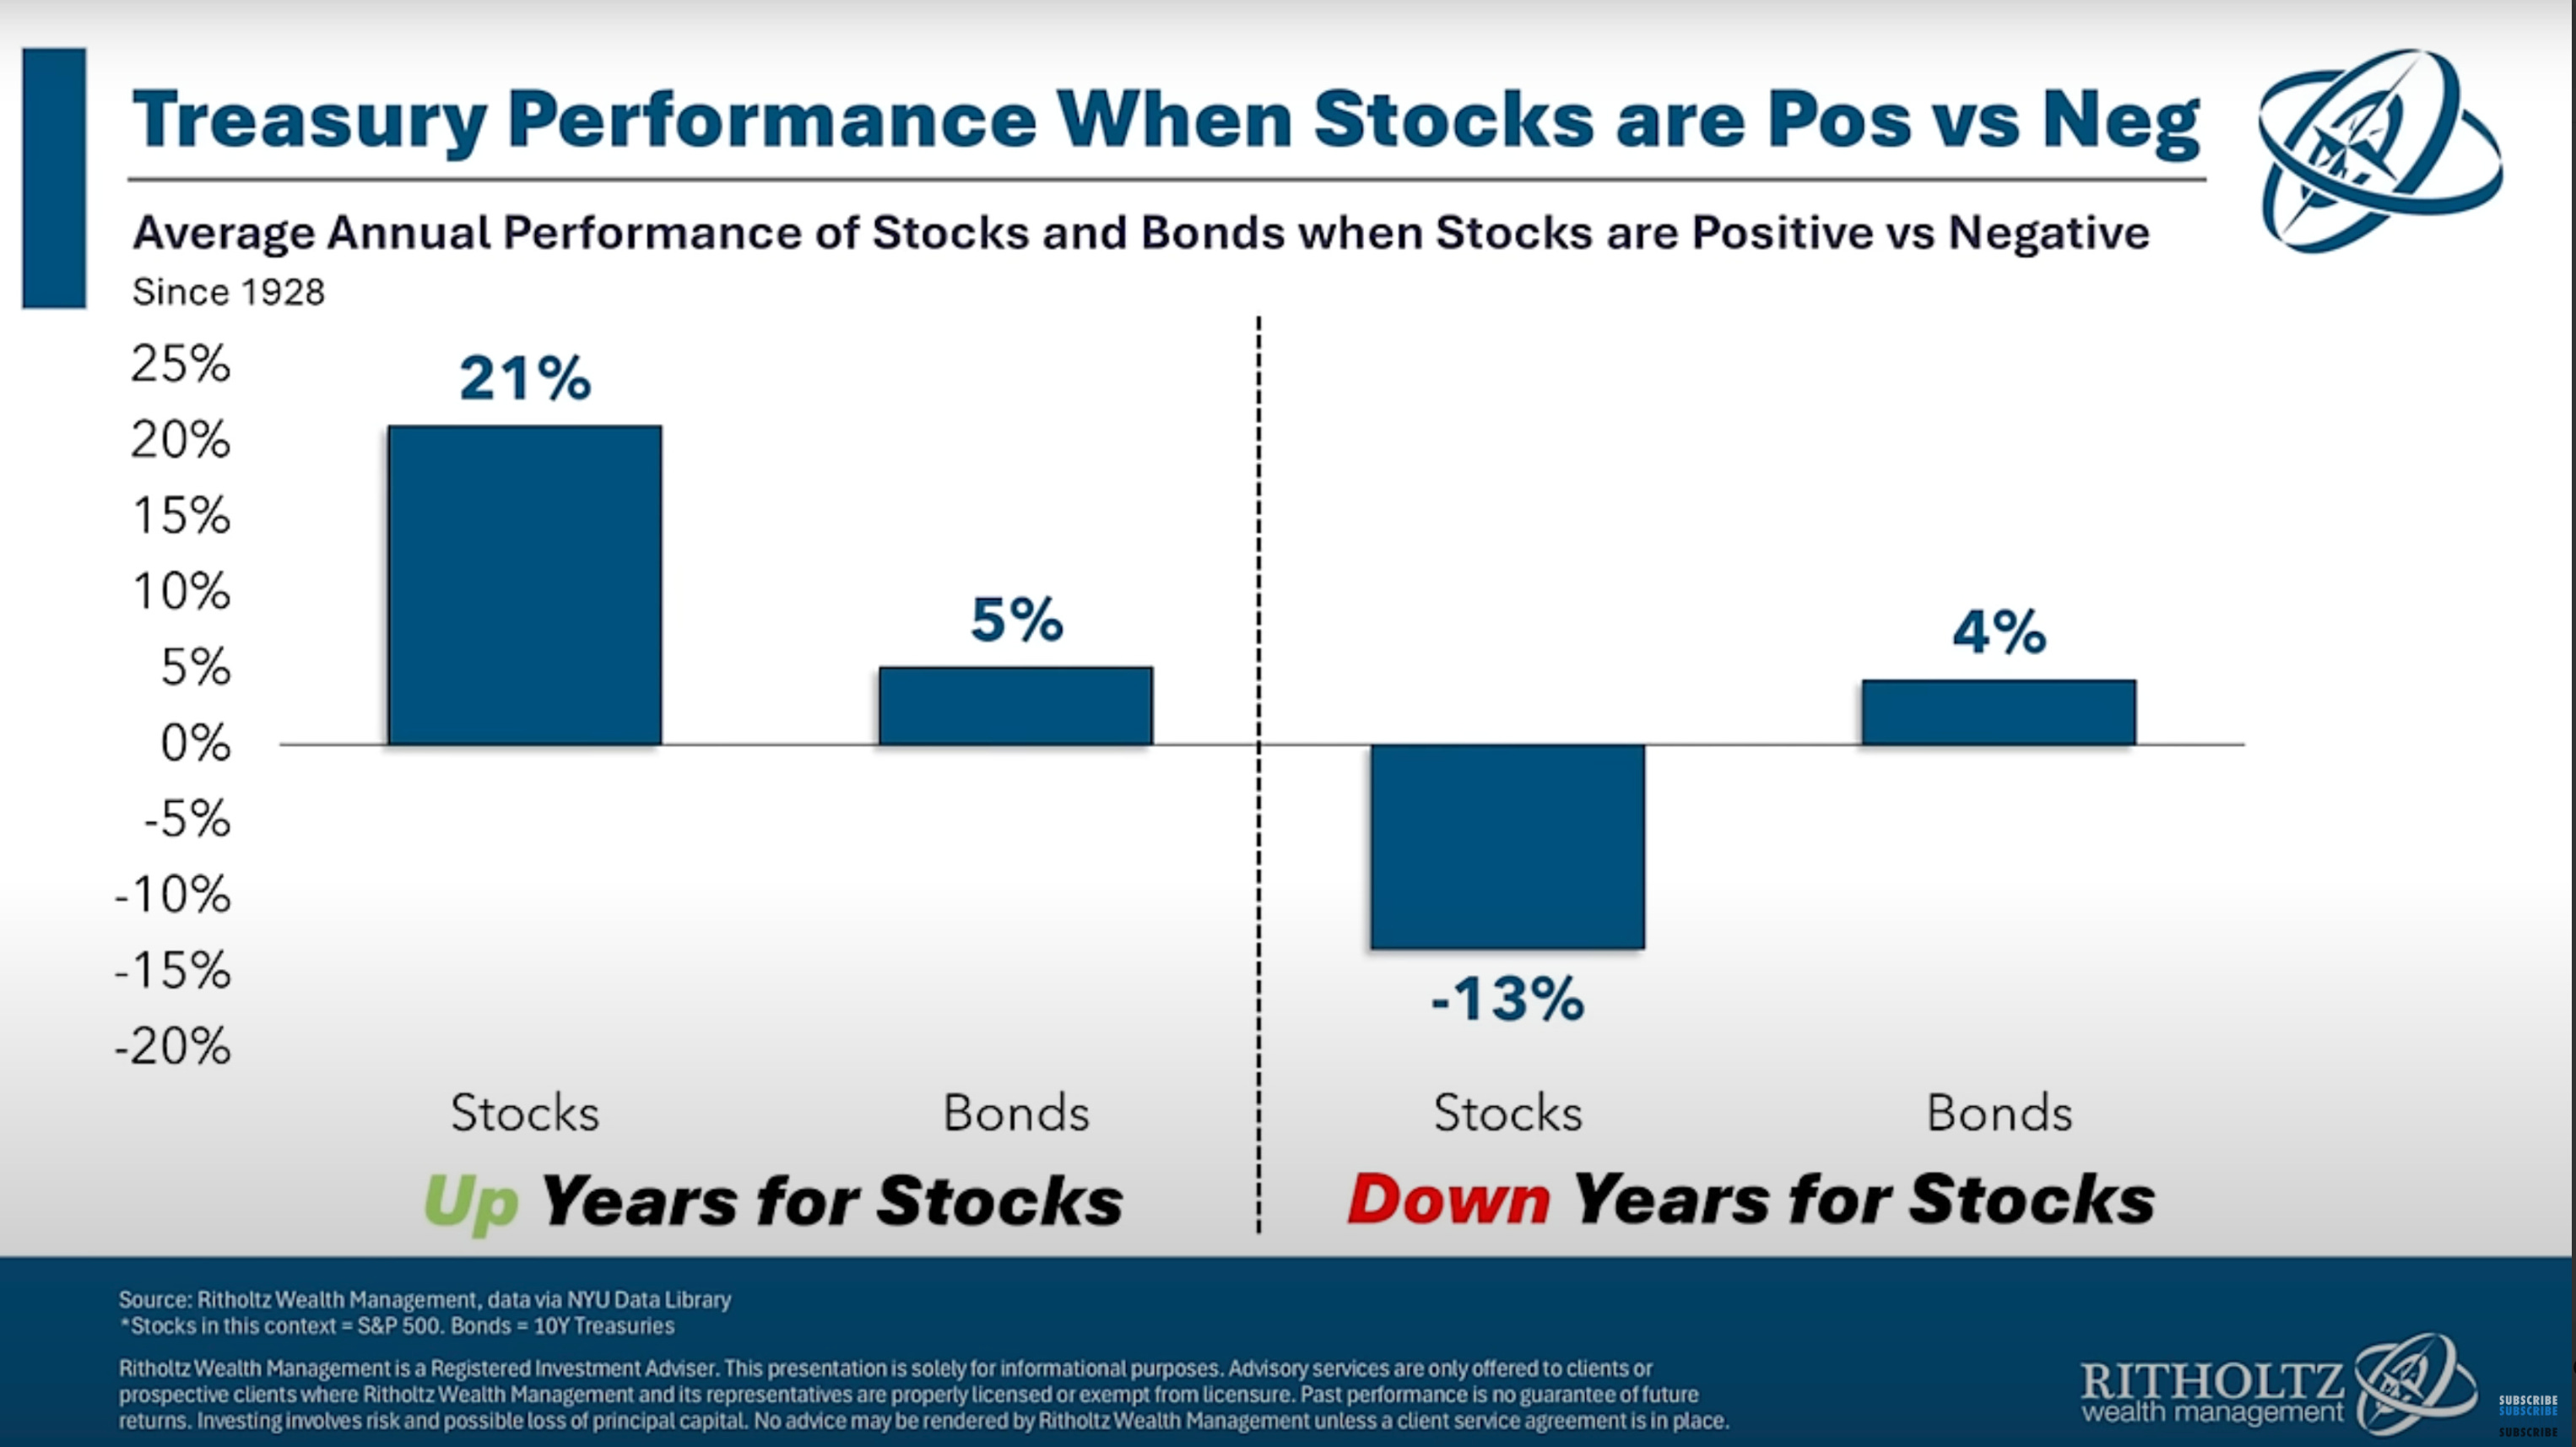
The average annual return for the S&P 500 on years when it is positive is +21%.
The average annual return for the S&P 500 on years when it is negative is -13%.
The name of the game is not to guess when the S&P’s are going to be negative.
The name of the game is to stay invested and accumulate more aggressively on the years you are “lucky” enough to see market corrections like -13%, and wait for those +21% years to come your way.
Takeaway: Stocks are up on average more than they are down, so it makes sense to focus on the long term accumulation of them at all times.
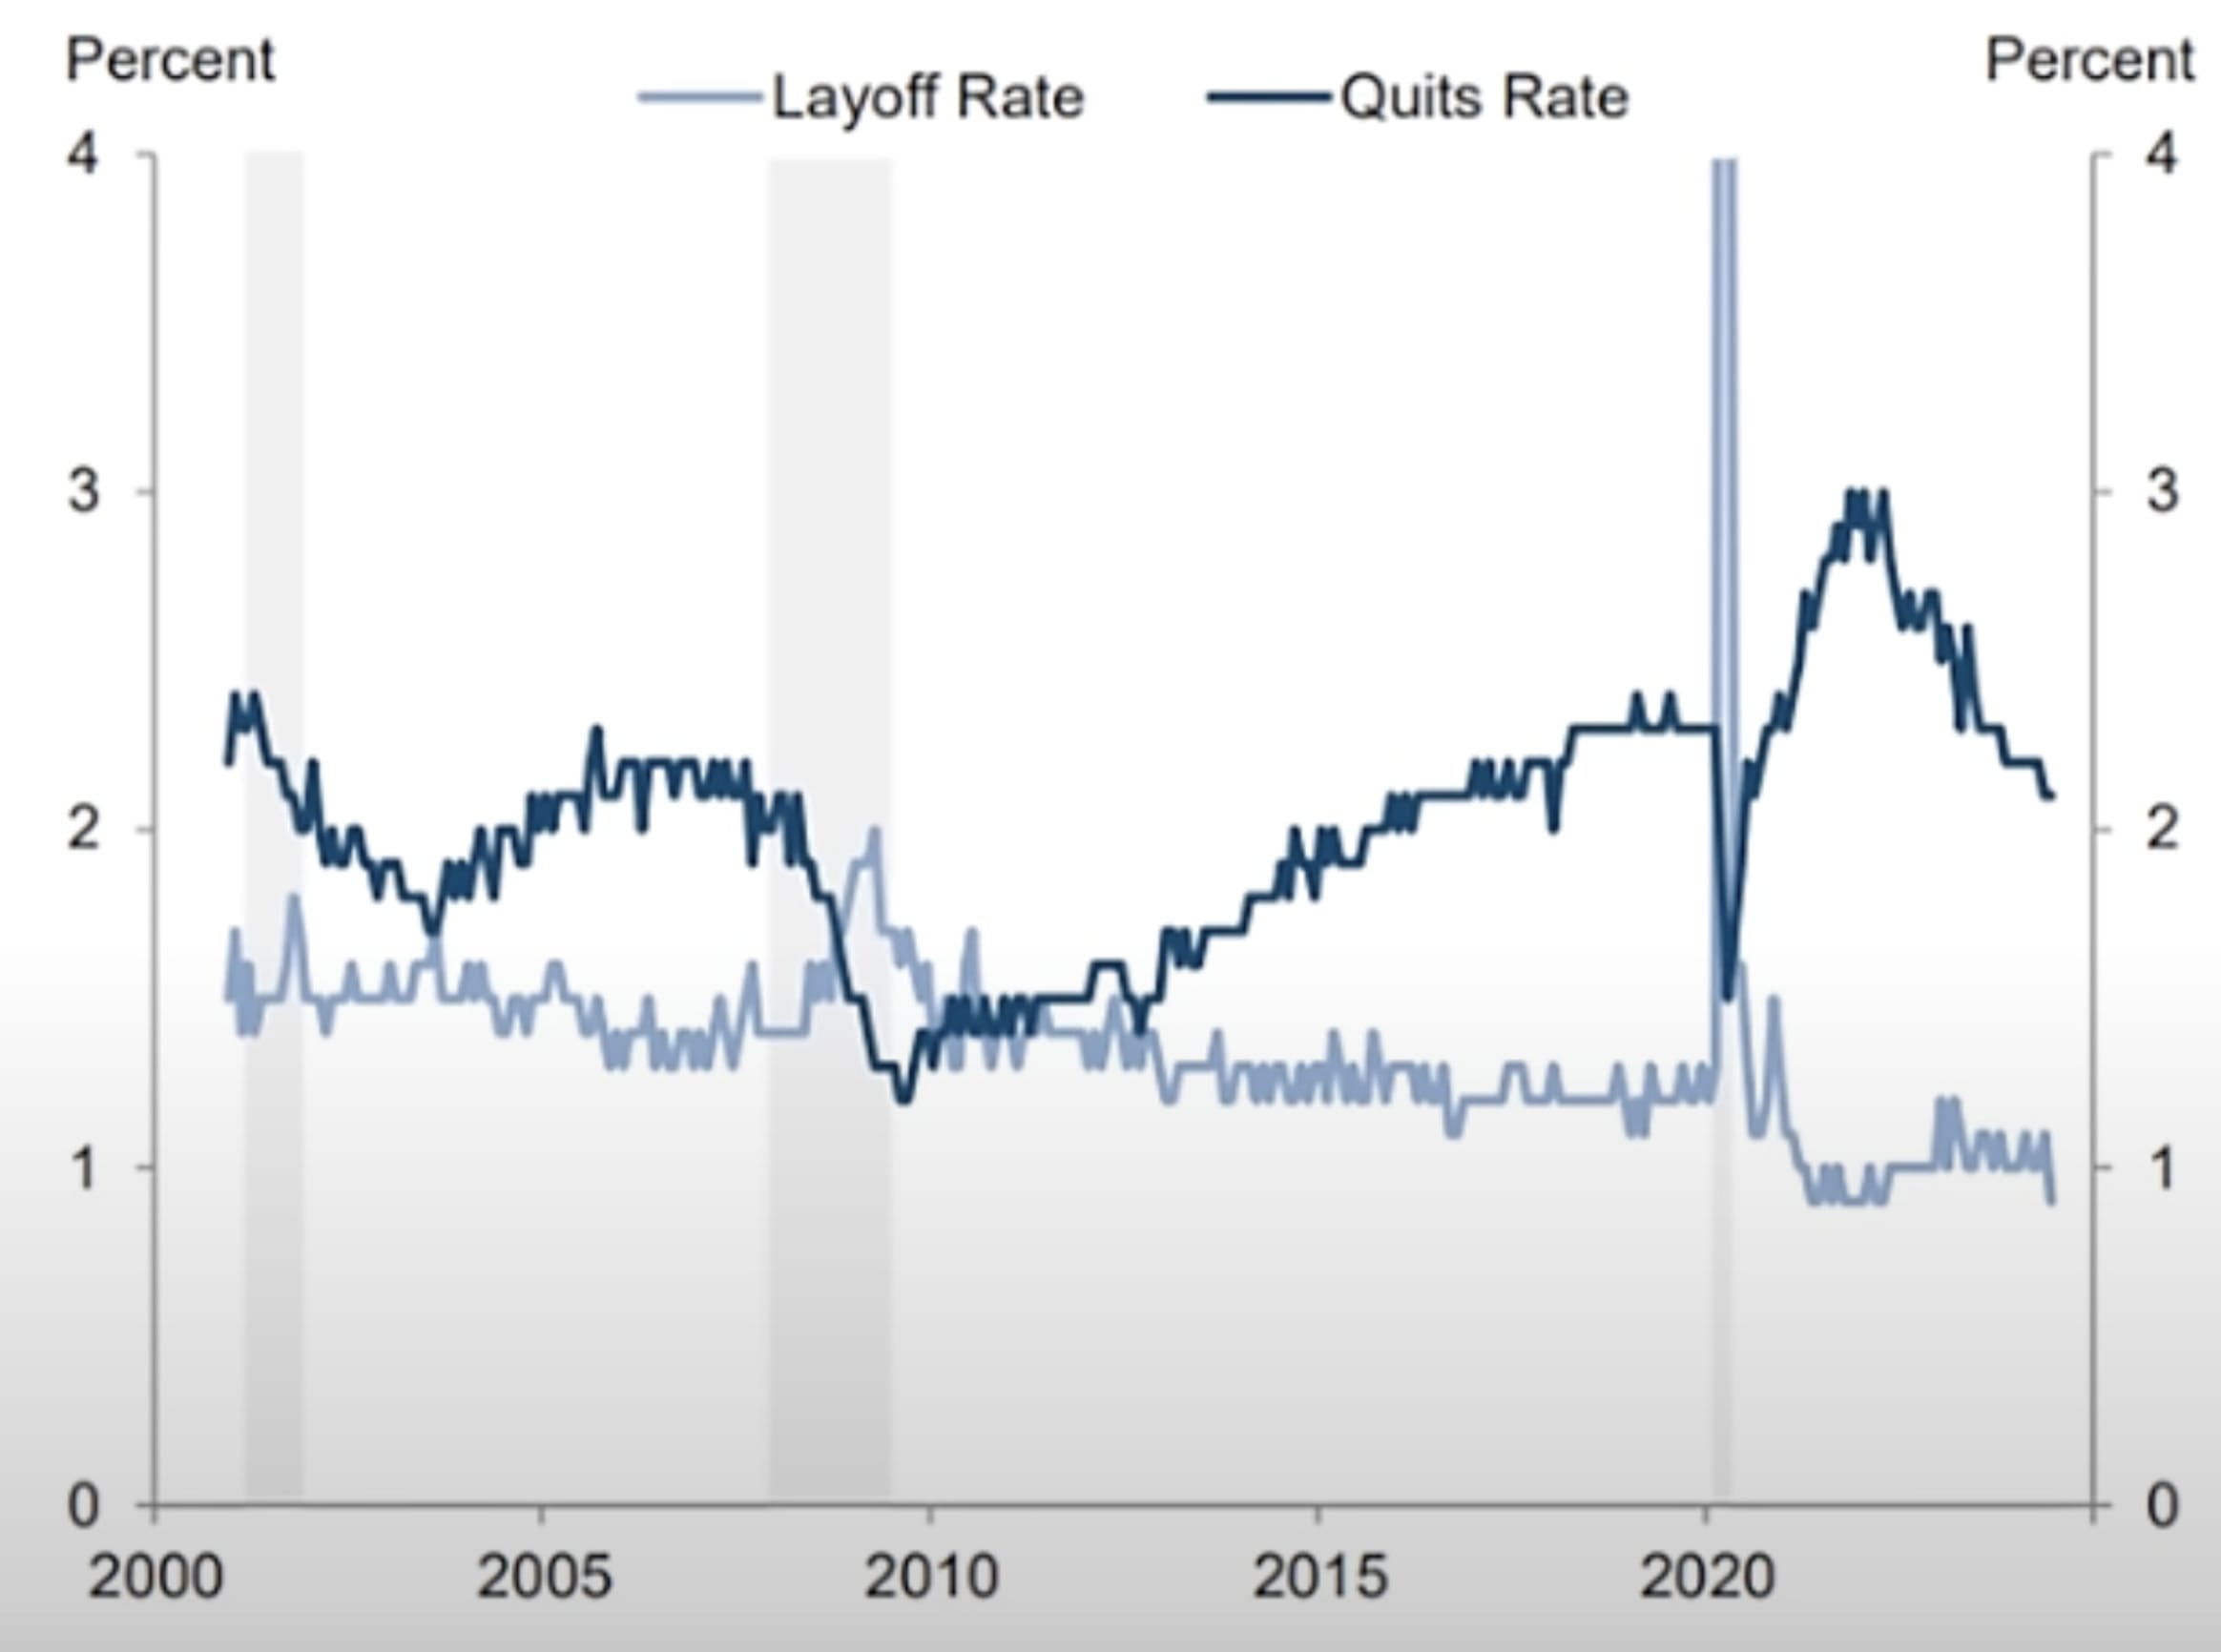
Layoff rates (light blue line) continue to remain around historic lows, which is not indicative of an upcoming recession. That means not many people are getting fired.
Even the quits rate (dark blue line) is moving lower. That means less people are quitting jobs.
Takeaway: This is more evidence that the increase in the unemployment rate is because of more people entering the labor force rather than existing workers seeing permanent layoffs.
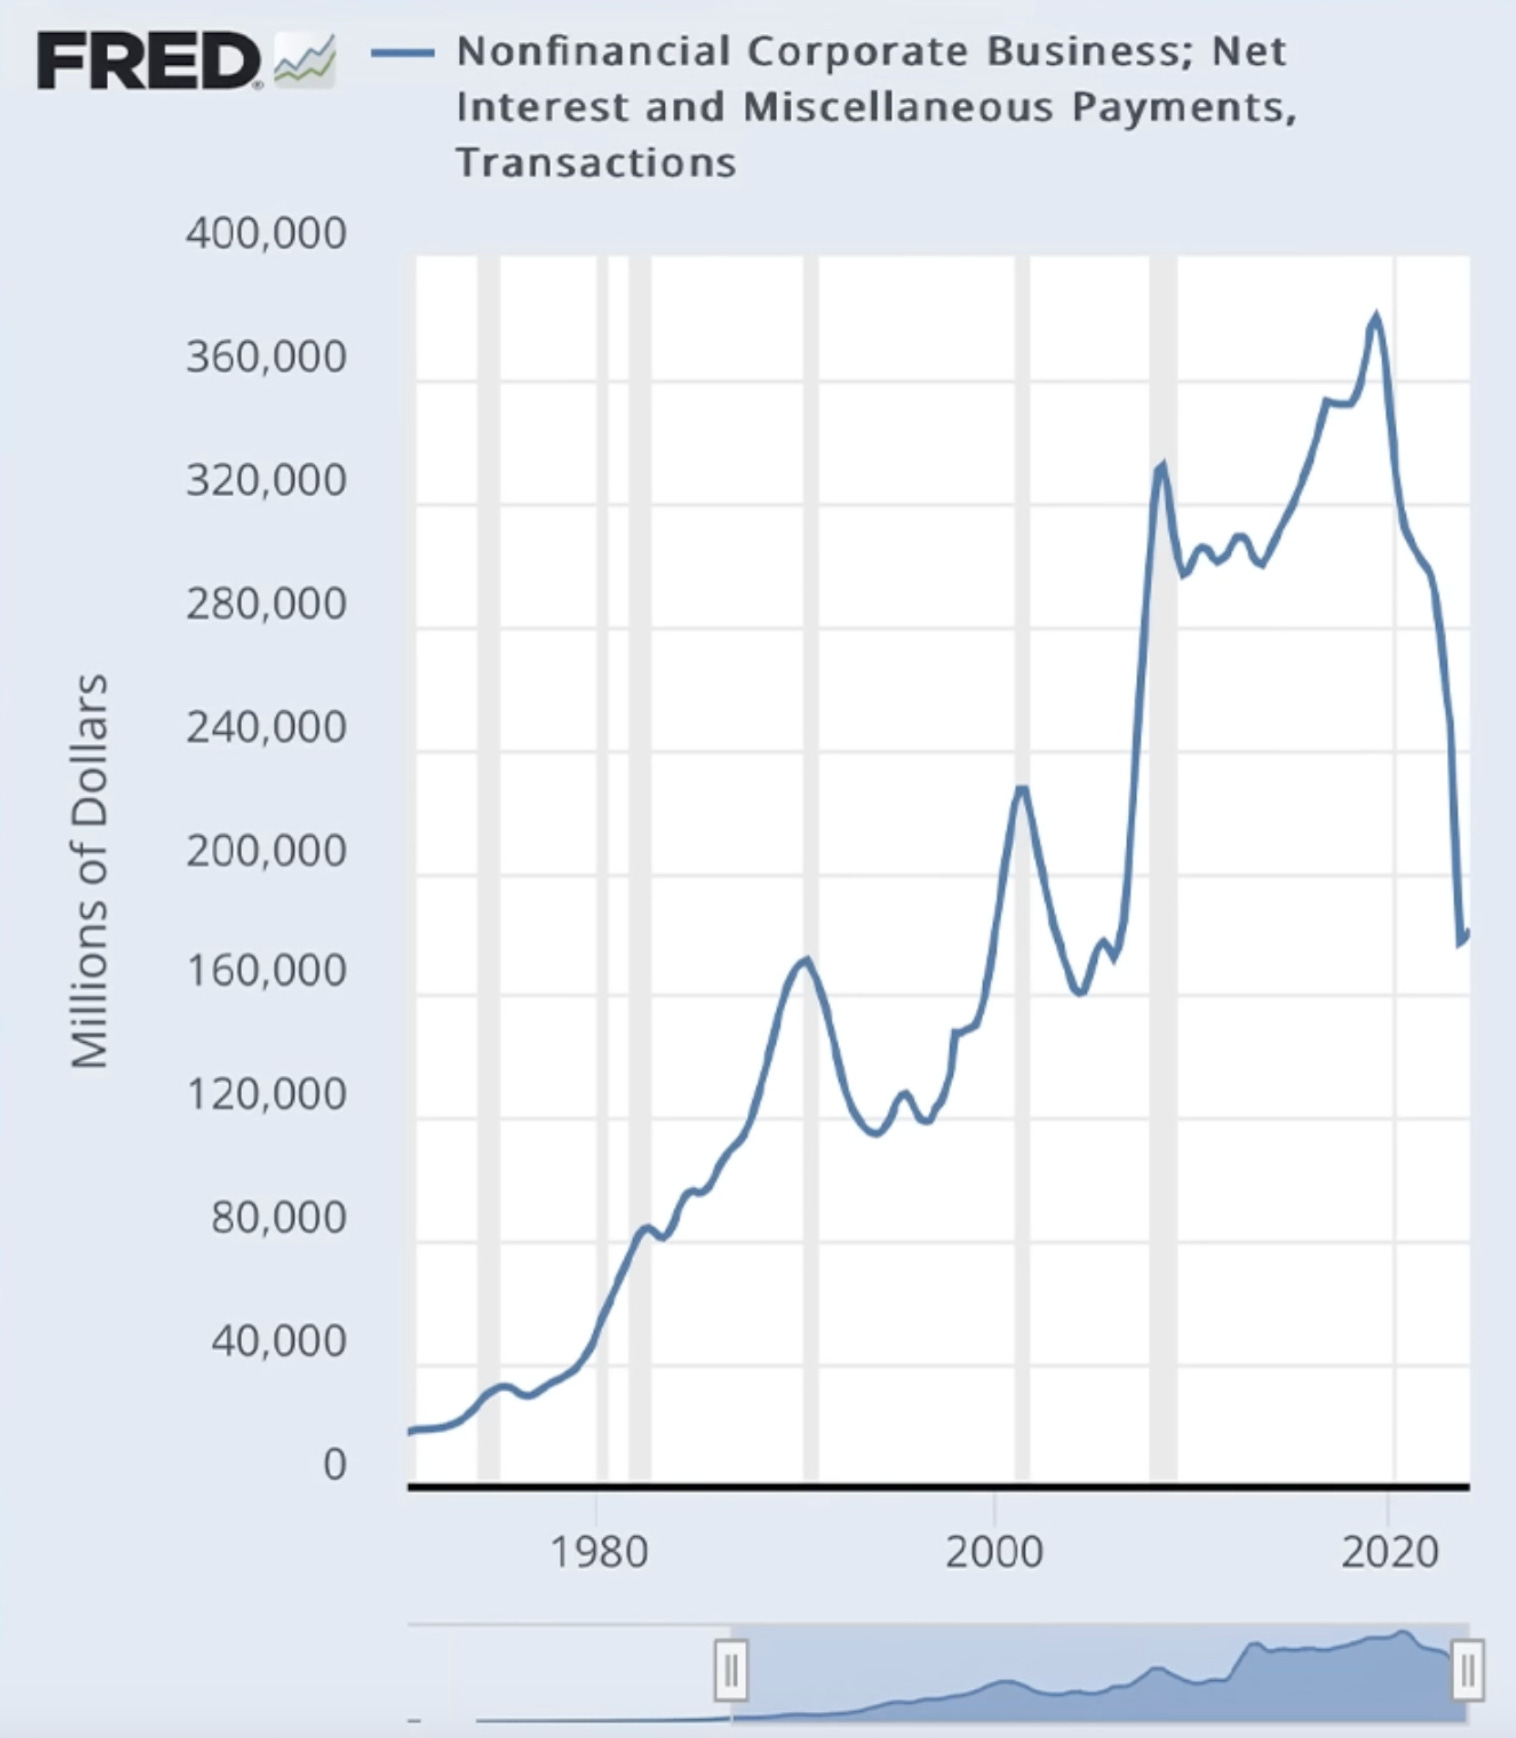
Amazing to see the Interest Payments that companies are paying skydiving LOWER recently.
How can that happen with interest rates rising?
Because some of the biggest companies in the world don’t rely on taking out loans to fund their businesses.
Think, the Big Tech Stocks.
Instead, high interest rates are helping them yield more money on their stockpiles of idle cash.
Takeaway: Higher interest rates are helping the strongest companies generate higher yields on their stockpiles of idle cash.
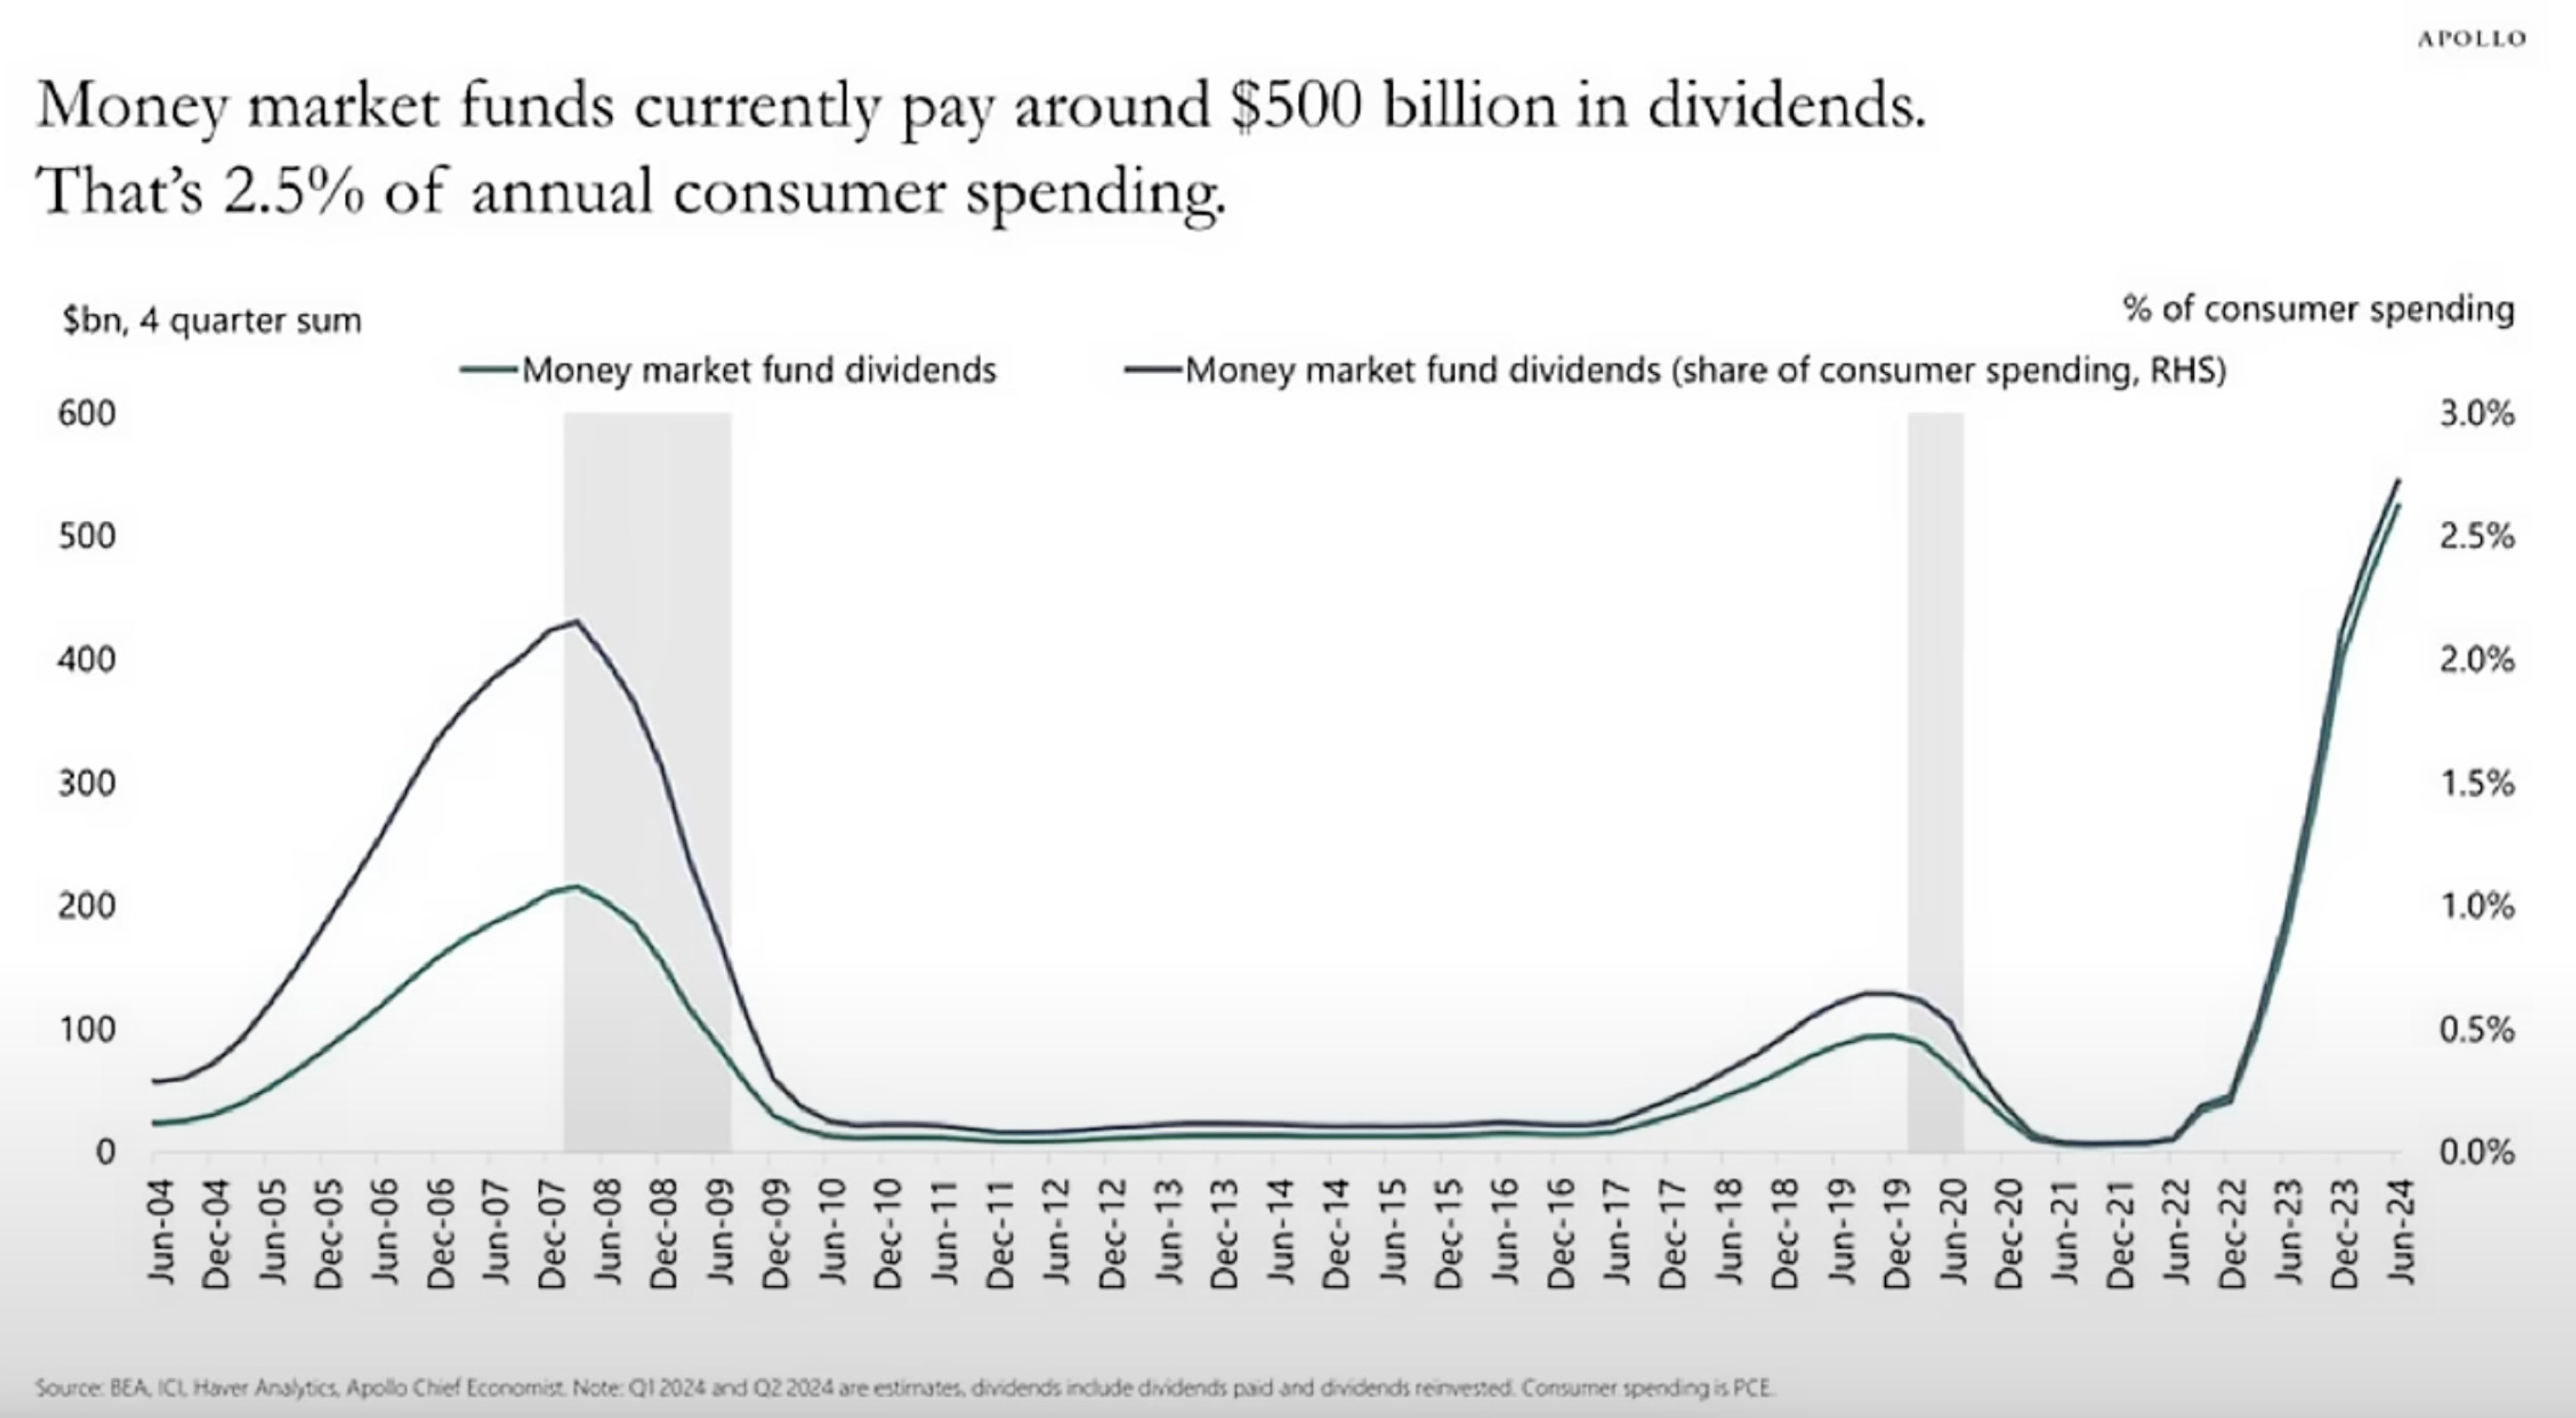
Money Market funds are paying the largest percentages relative to consumer spending in history.
This is one reason why consumer spending is staying strong and making it difficult for a deep recession to show up.
Takeaway: Higher interest rates are creating dividend yields that are amongst the highest levels of consumer spending in history.
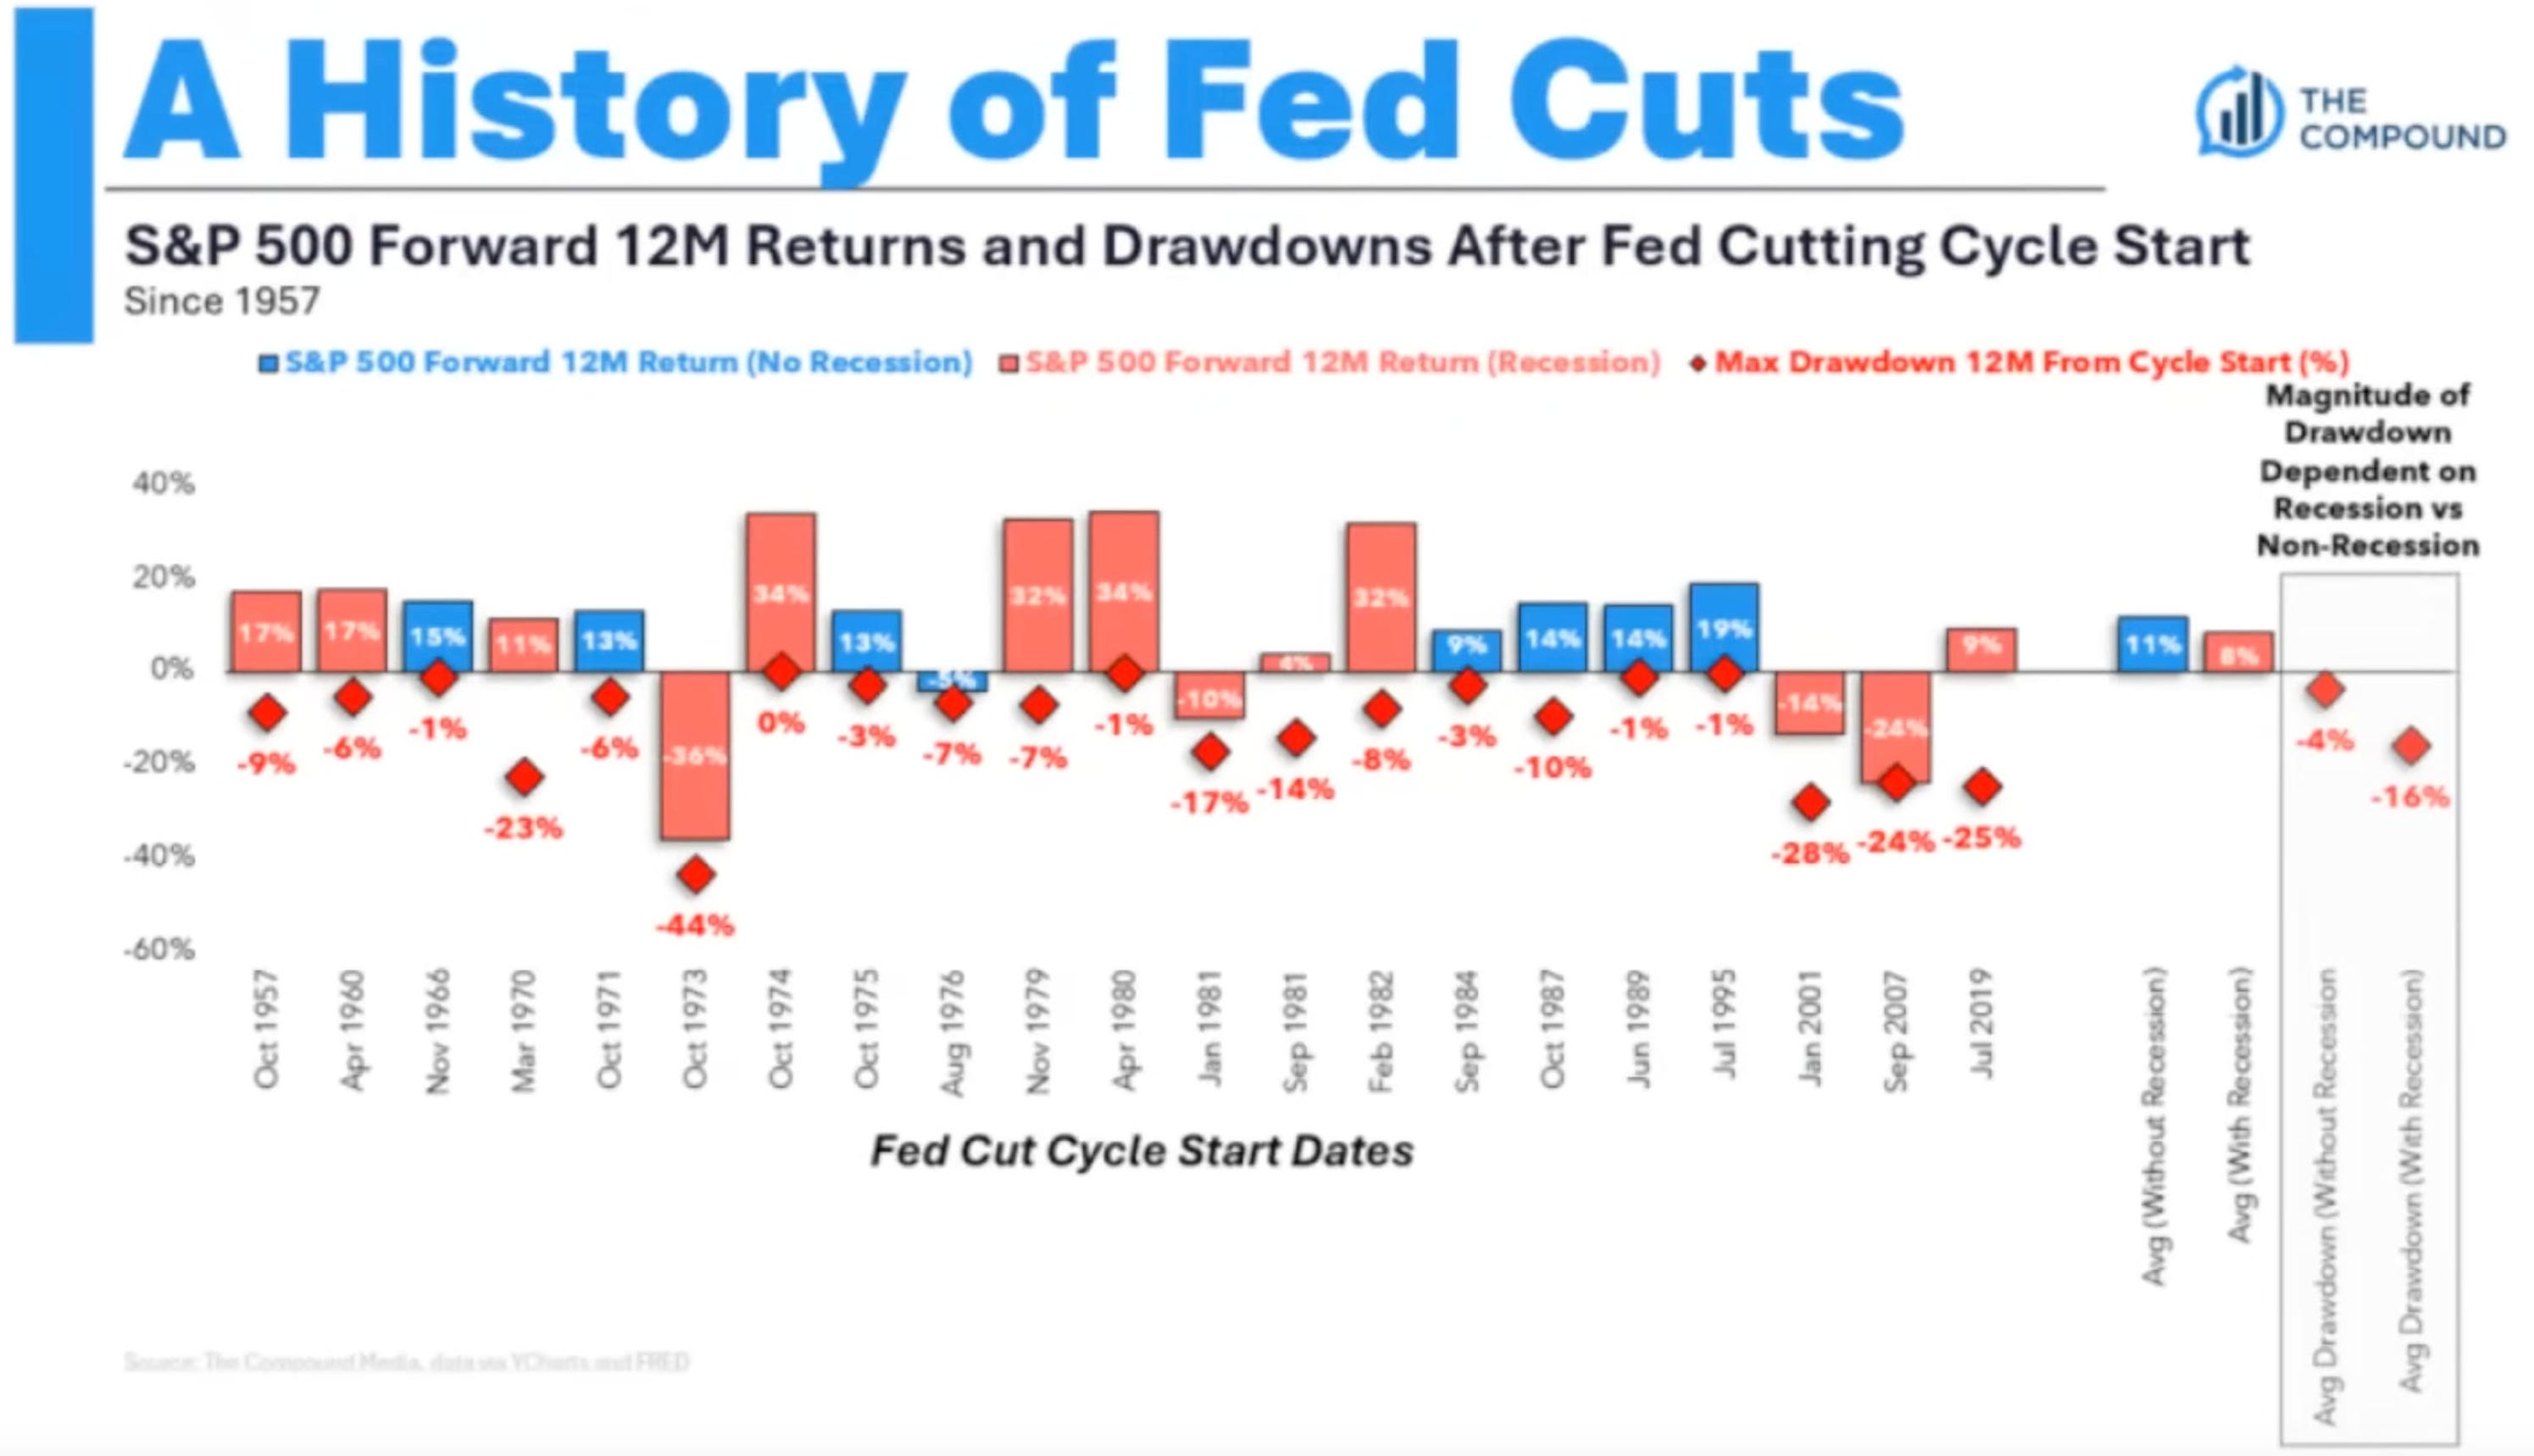
This chart shows the 12 month returns after the FED starts cutting rates since 1957.
The red bars signify times there was a recession.
The blue bars signify times we were not in a recession.
17 out of the 21 periods shown had positive returns even though there was 13 recessions in the mix.
That’s 80% of the time that the market had a positive 12 month return, regardless if there was a recession or not.
During recessions, the average drawdown was -16%.
When not in recessions, the average drawdown was -4%.
Takeaway: Rate cuts even during recessions are not a great reason to sell stocks you have medium or long term convictions with.
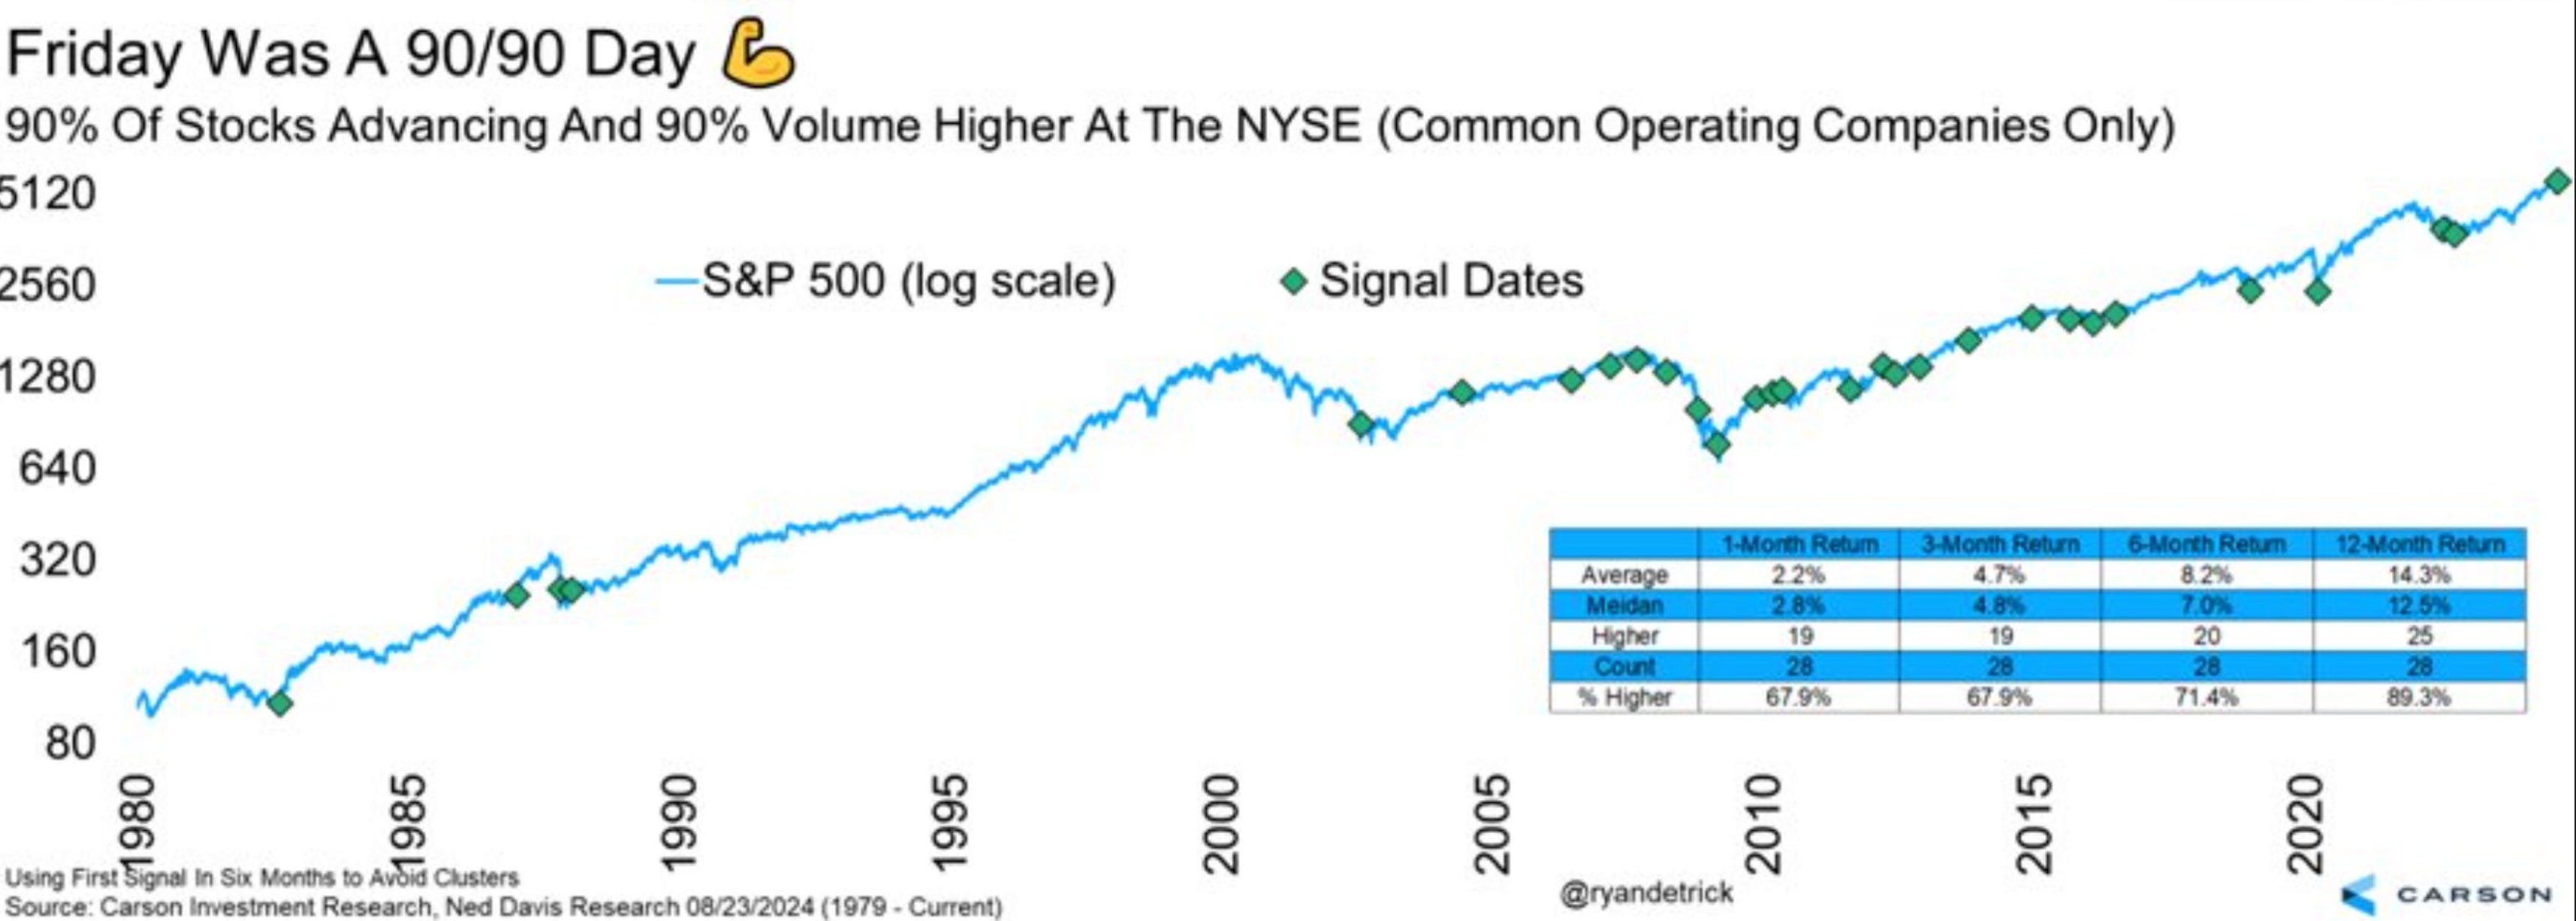
Friday was a “90/90 day" according to Ryan Detrick on Twitter.
90% of stocks were up and 90% of the volume was higher for the first time since the end of the bear market in October of 2022.
The 12 month returns after this signal since 1980 are higher 89.3% of the time, with an average annual return of +14.3%
Takeaway: Most stocks are moving higher and doing so with larger volumes, which is a bullish signal historically.
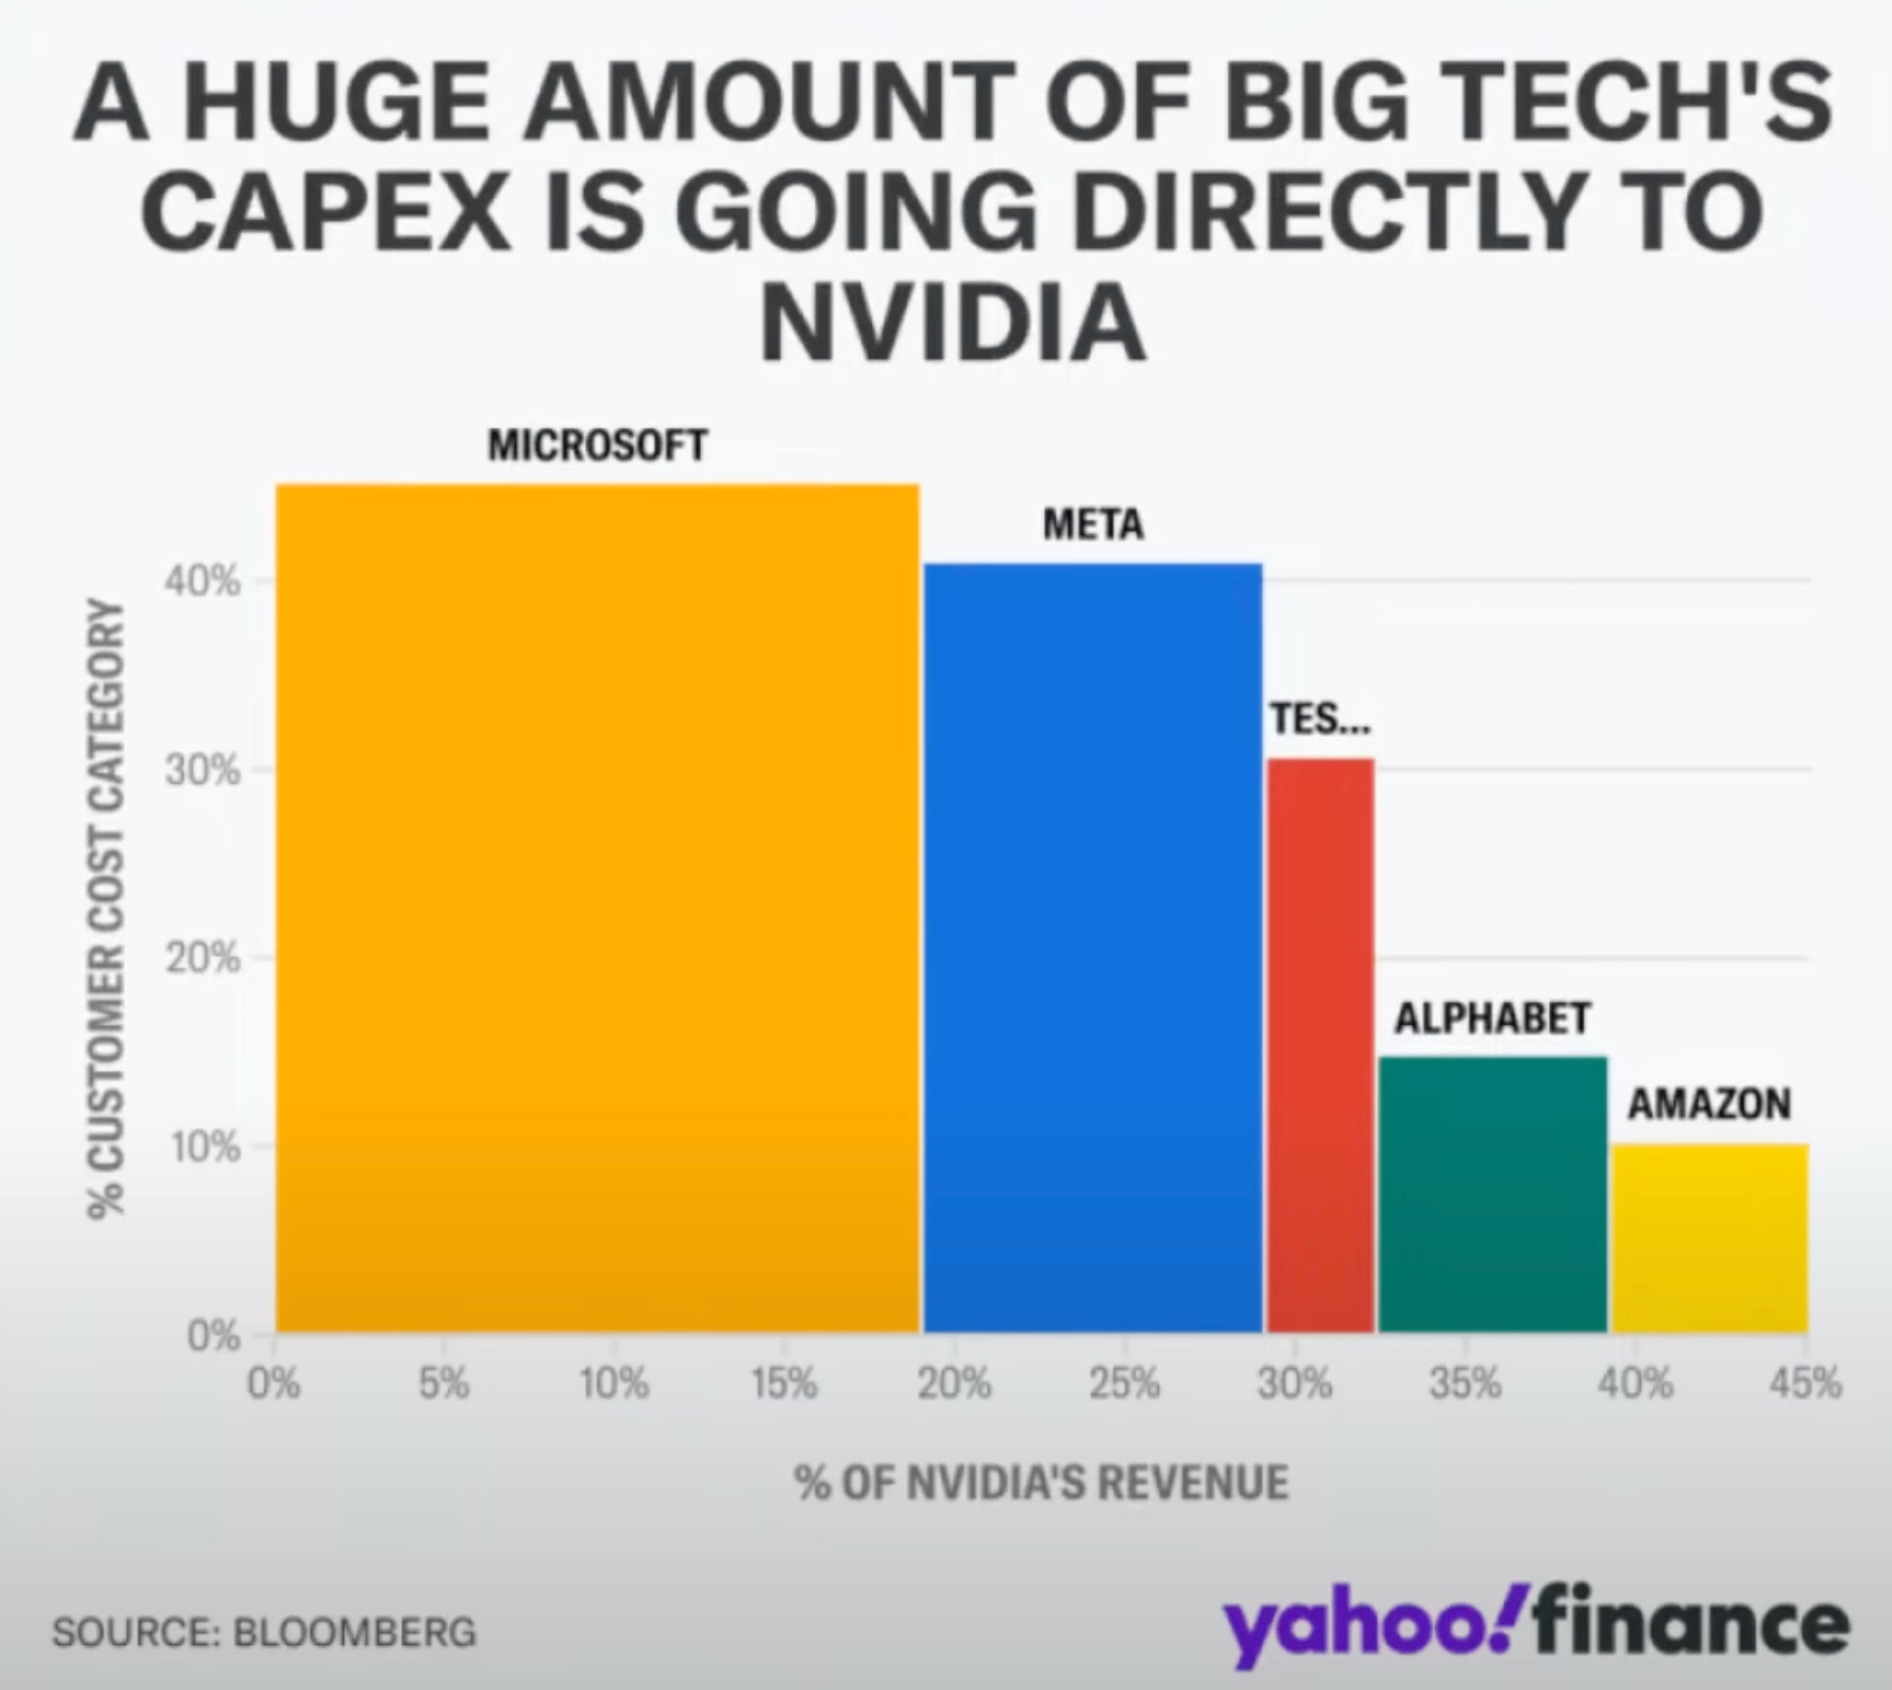
This chart’s vertical access shows how much these companies spend on NVDA’s products.
The chart’s horizontal access show how much of NVDA’s revenue comes from that company.
For example, MSFT spends over 40% of their of CapEx directly to NVDA, and that makes up almost 20% of NVDA’s revenue.
NVDA has the largest companies in the world spending a good percentage of their CapEx to buy their products.
Some say this is bad.. but what else do they have that cash for?
They need to spend that cash on ways to innovate and grow their business.
What better way to innovate these days than find ways to leverage AI?
Even worse, the more a competitor spends compared to you the further behind you might get left in the race.
Game theory at its finest.
Takeaway: The biggest and most powerful companies in the world are all betting big to win the AI race.
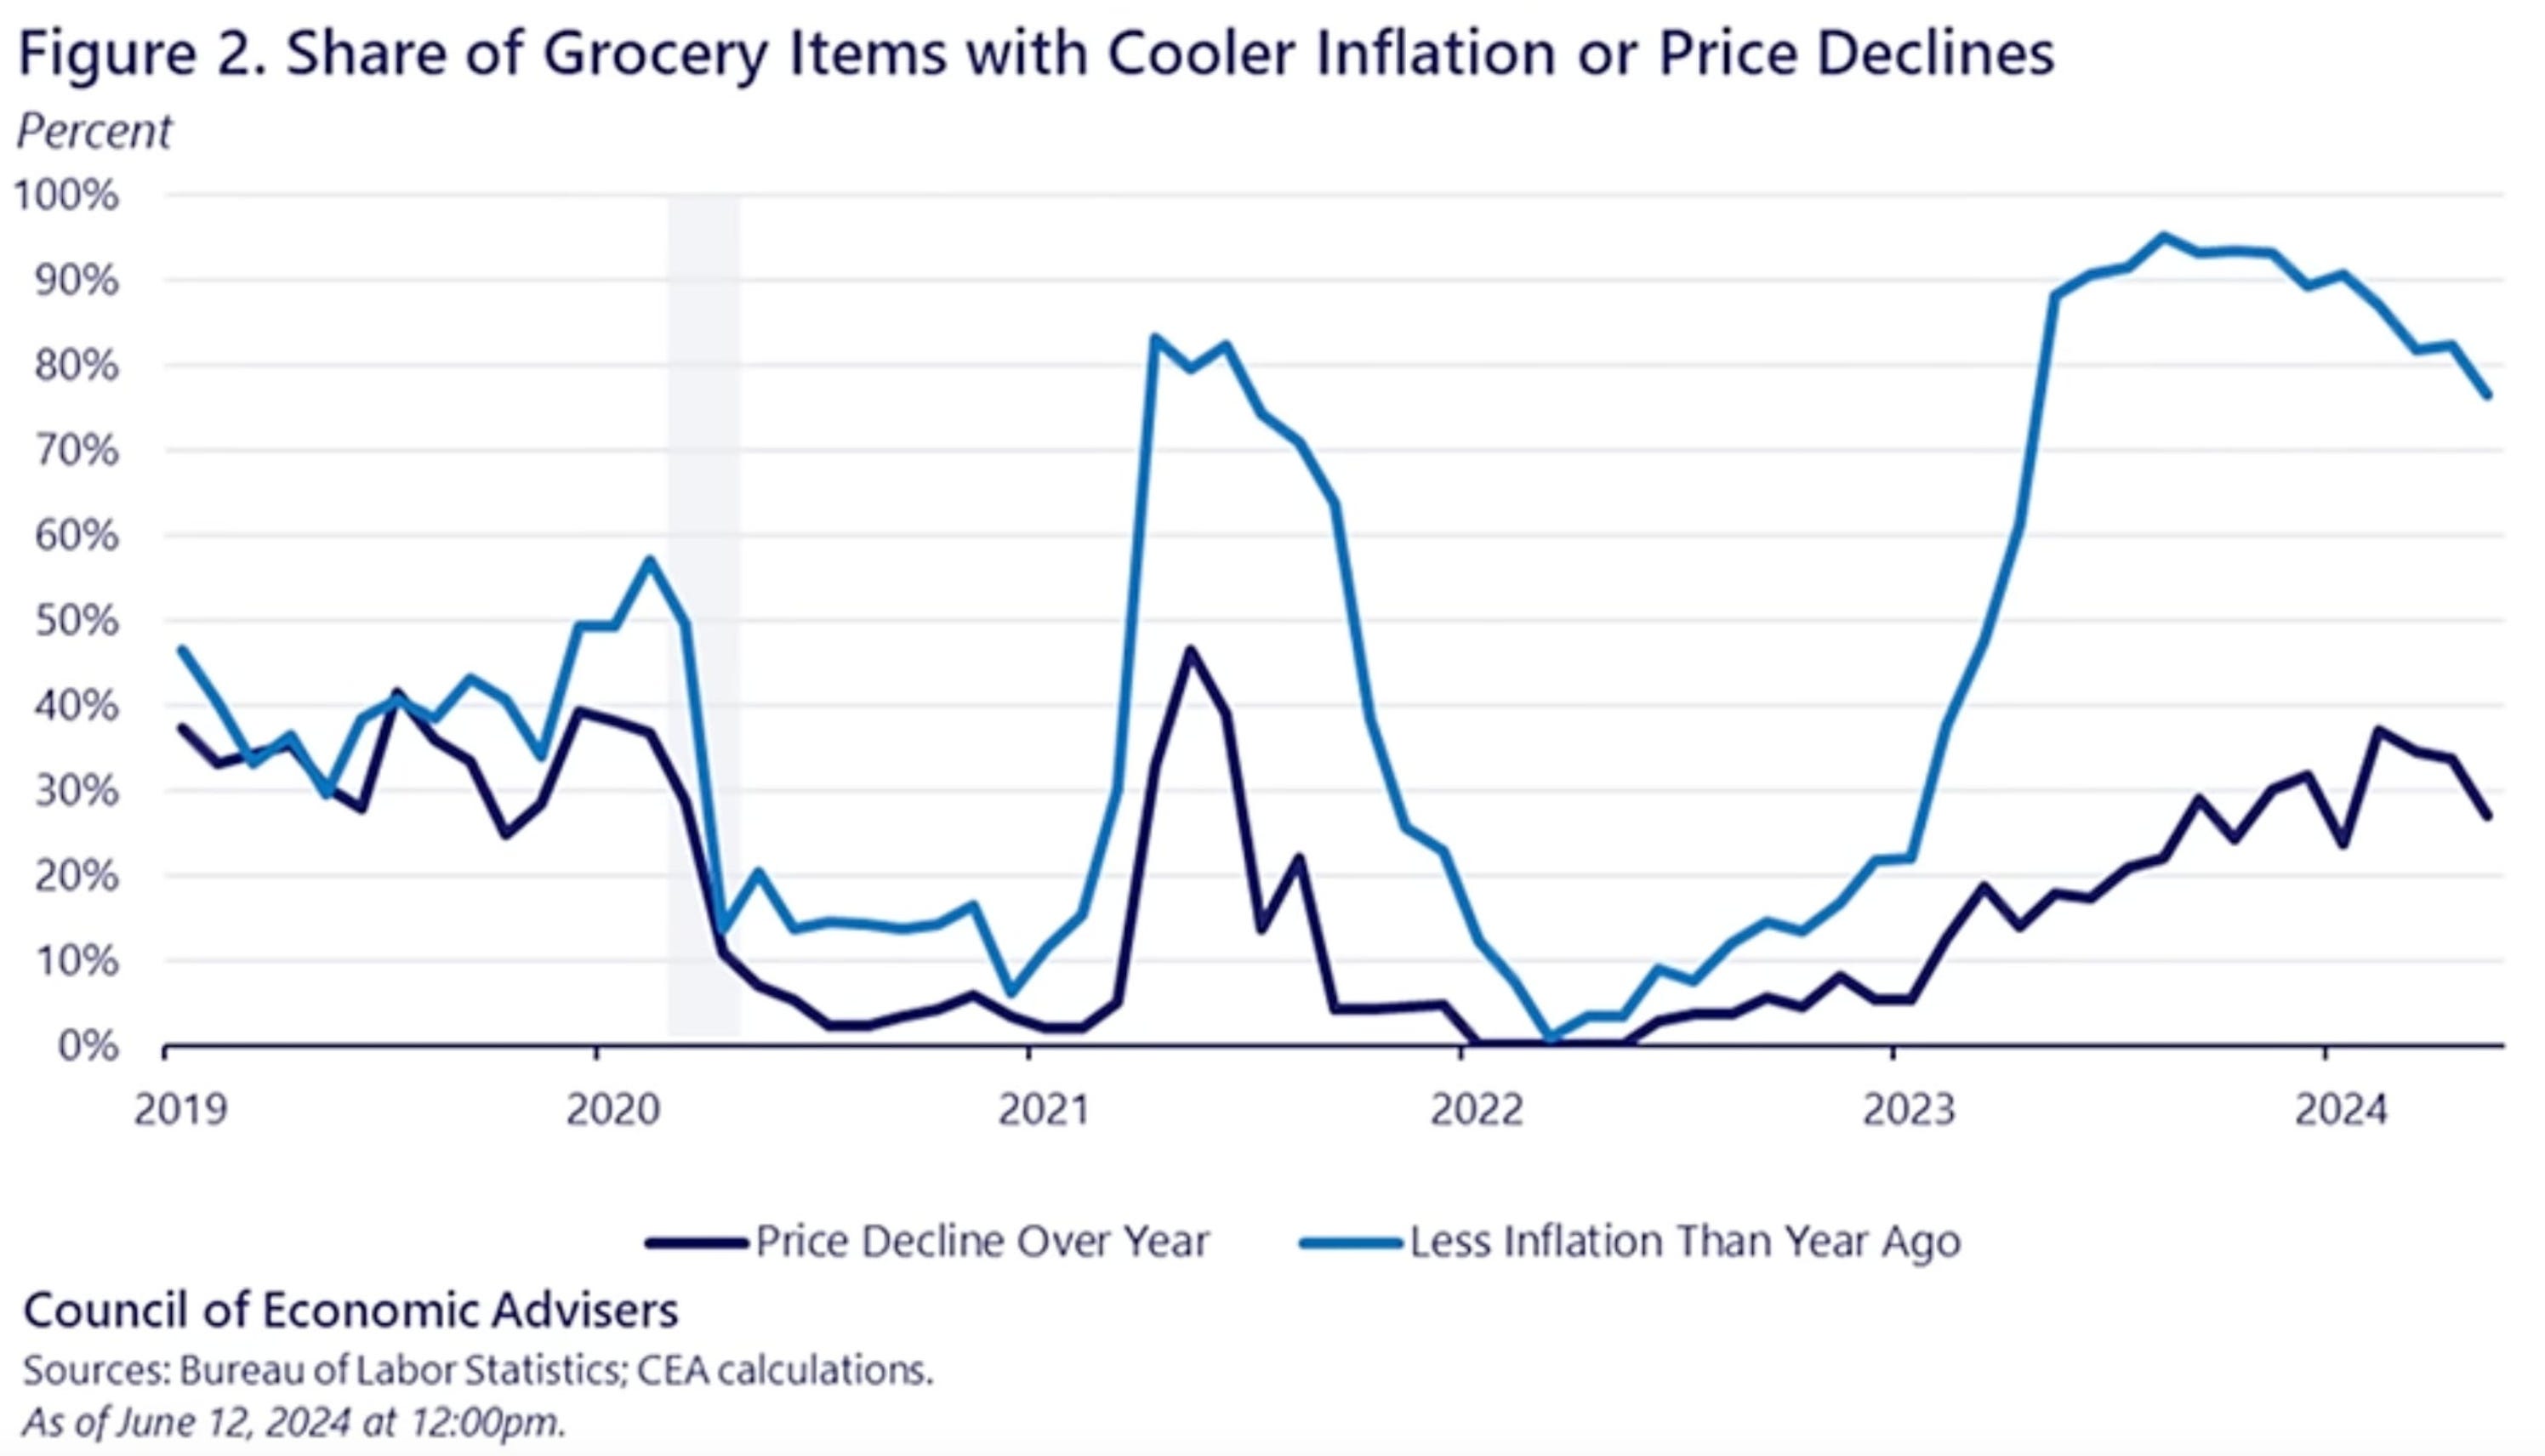
Grocery prices, both the rate of change and the actual prices of groceries are heading lower.
The rate of change inflation number is the blue line — moving lower since mid 2023.
The actual price of groceries is the purple line — moving lower since the first few months of 2024.
Takeaway: Grocery prices are moving lower.
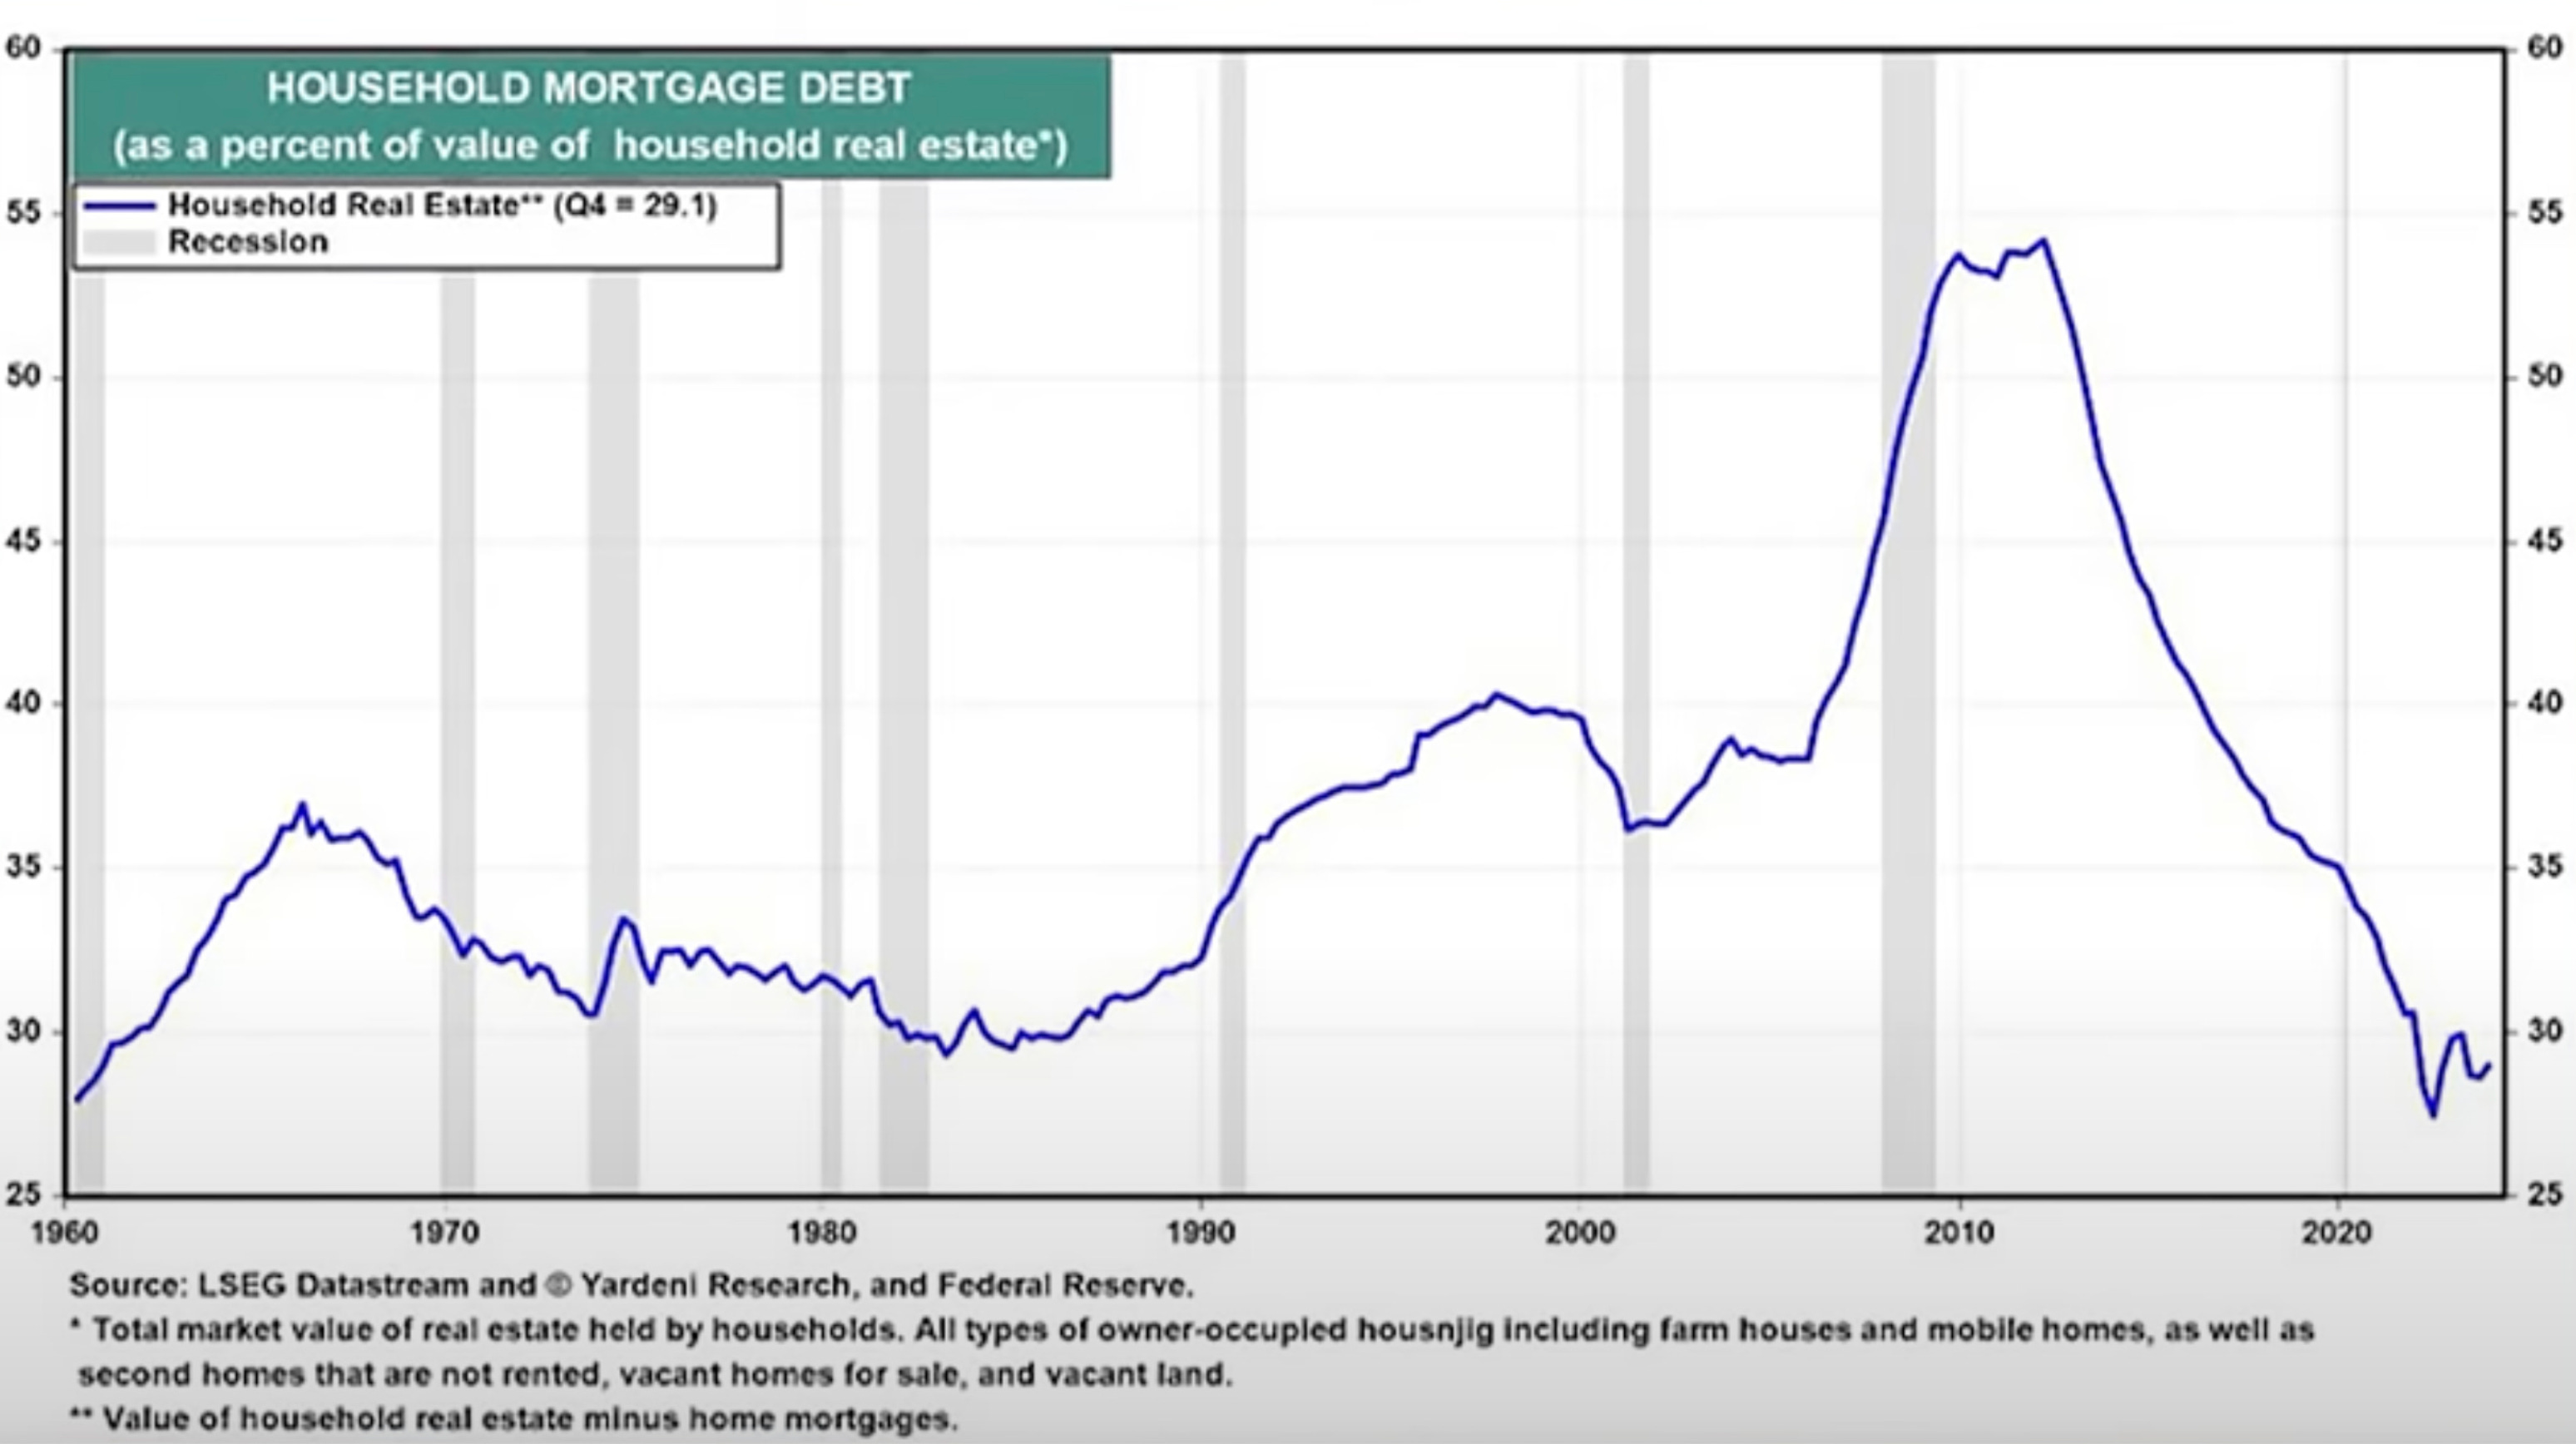
This chart shows the value of household real estate minus home mortgages is at historically low levels.
That means the mortgage debt on a home is low relative to how much the house is currently worth.
Part of this is because the value of real estate has appreciated a lot, as has the price of all assets, since 2009.
That is because of the FED’s new found era of money printing to save the economy from the Great Financial Crisis and every crisis thereafter.
The other reason is because most people have locked in low interest rates by taking on mortgages before the interest rate rises started.
Takeaway: Home prices have inflated aggressively relative to the debt it was financed with 5-10-20 years ago.
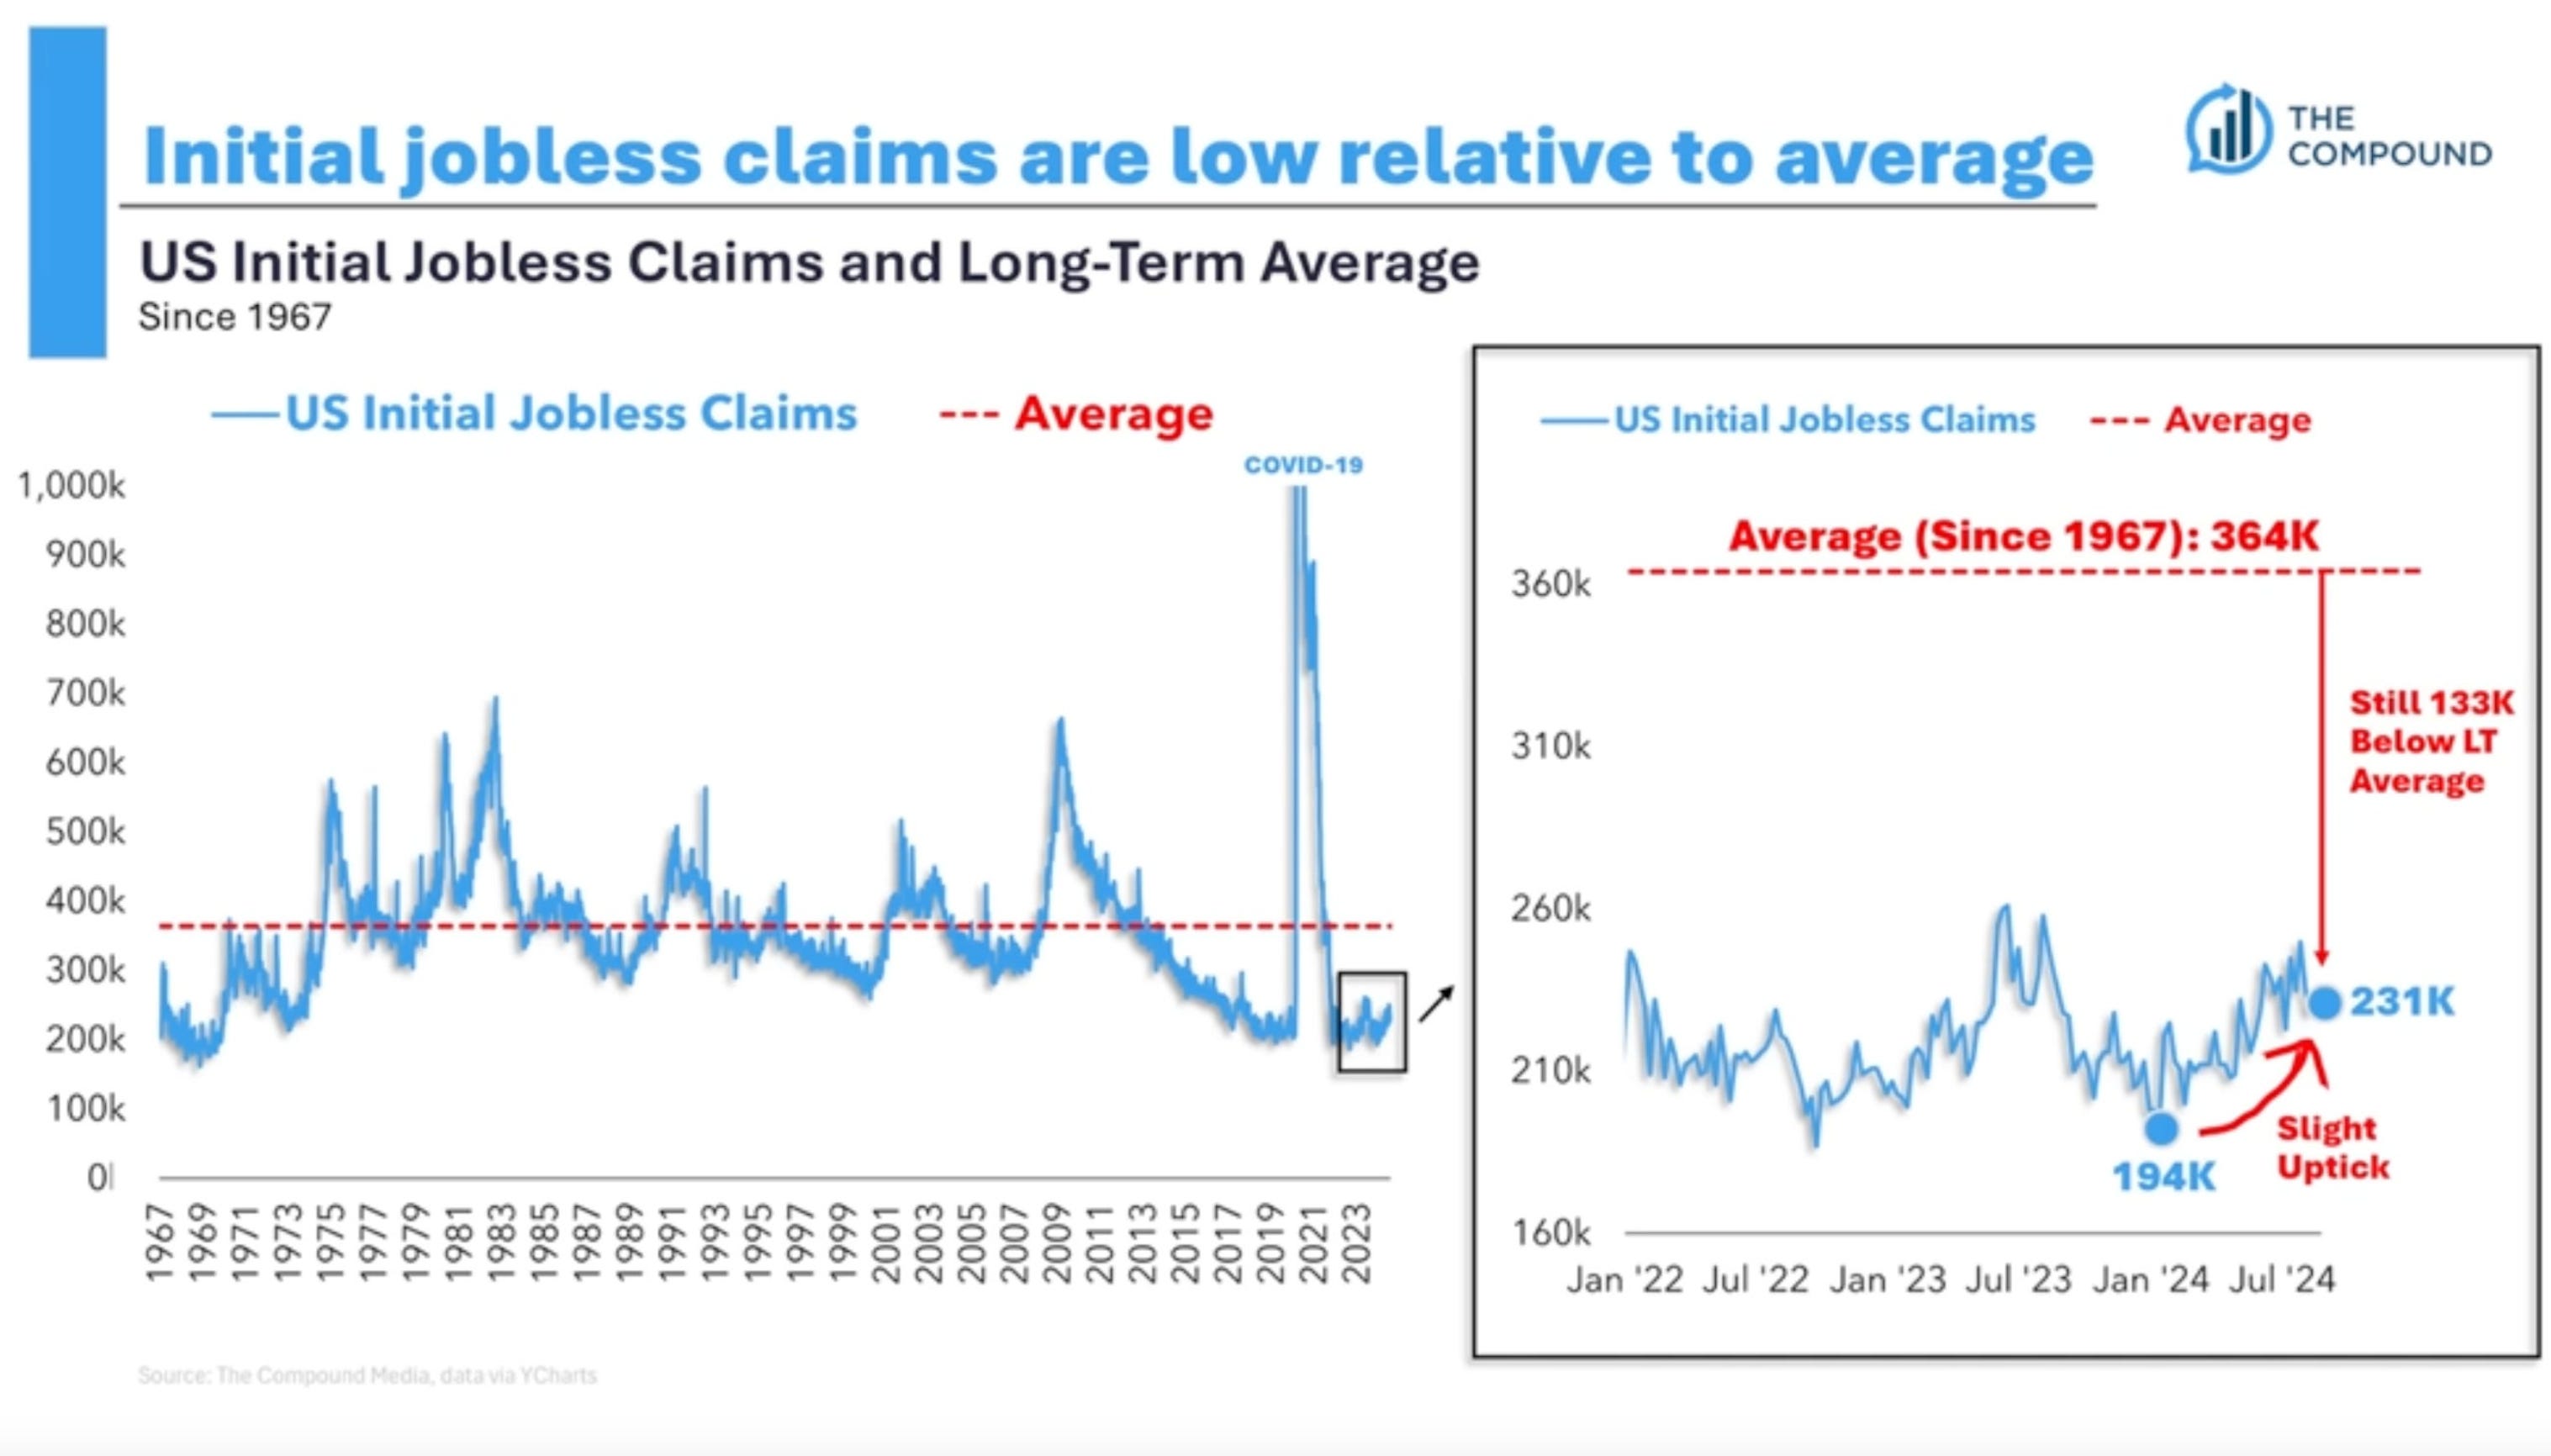
This chart shows a weekly data set of US initial jobless claims that are still historically low.
These are new people who are filing for unemployment.
We are still very much below the weekly average (red line), indicating that there is not a widespread amount of jobs being lost at the moment.
Takeaway: Permanent job losses remain low, which is more evidence that the recent rise in the unemployment rate was due to an increase in the labor force rather than people getting fired.
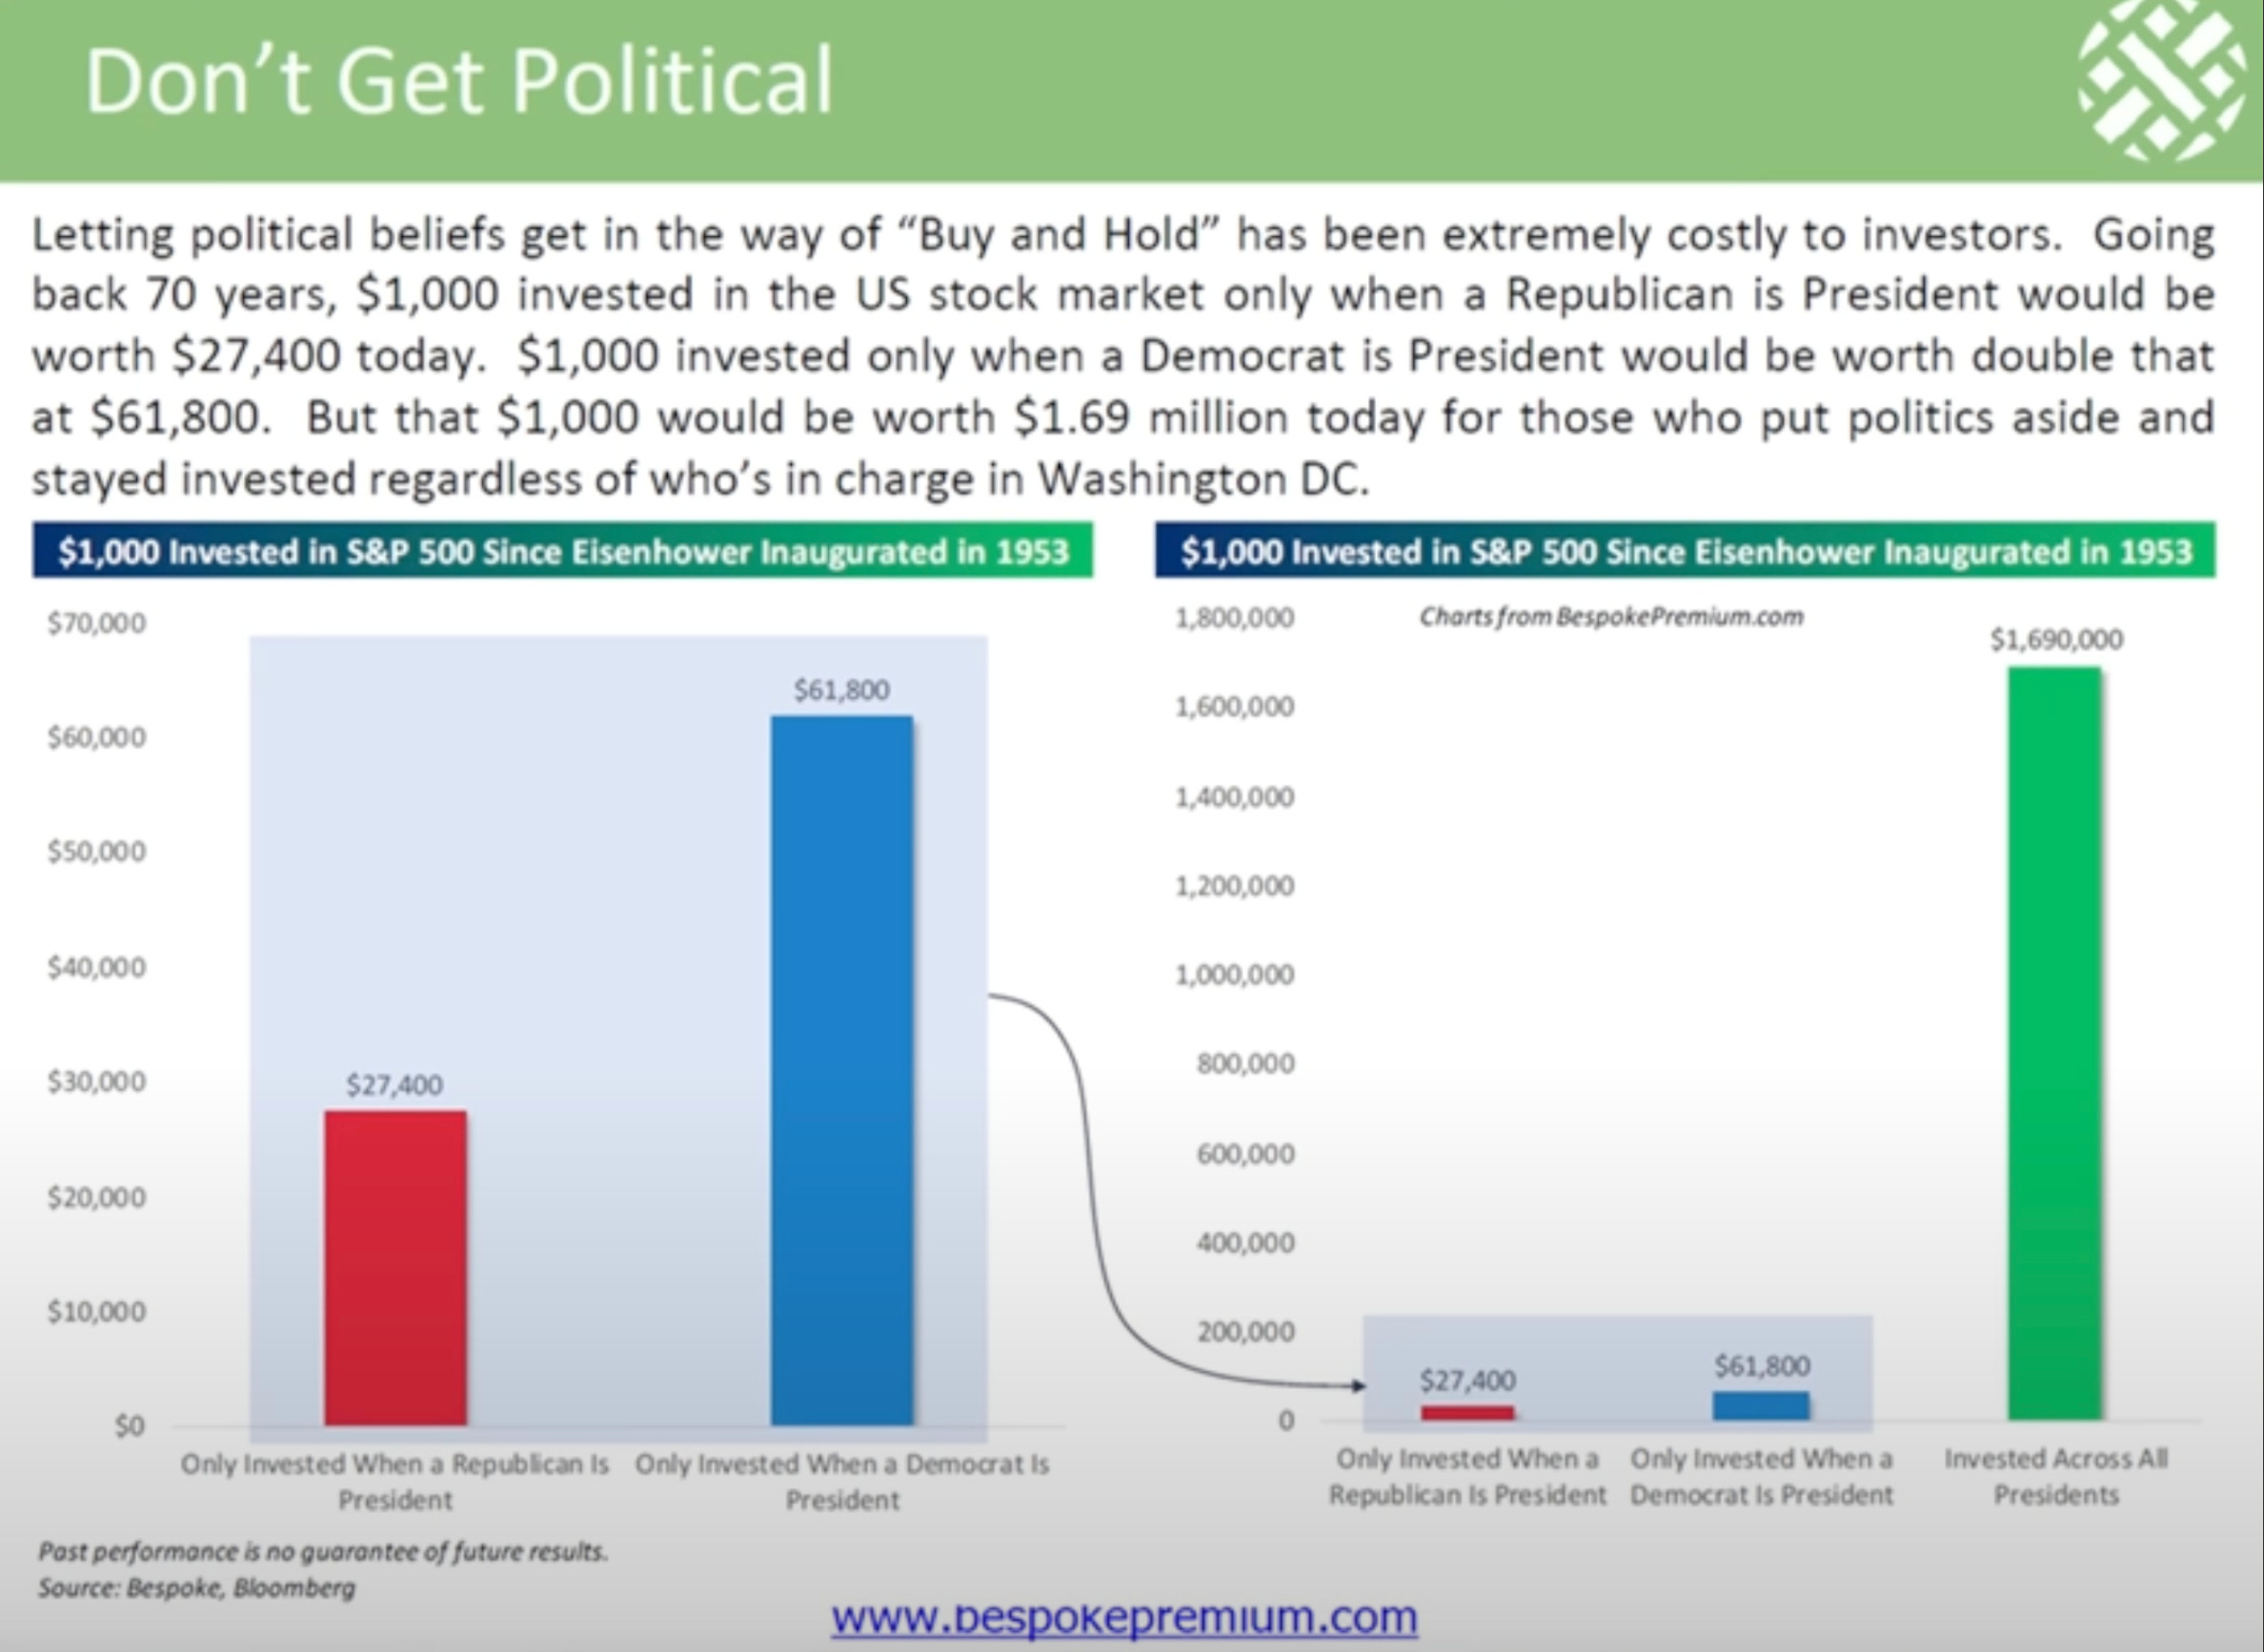
If you invested $1,000 in 1953 and stayed invested only when there was a Republican president you would have $27,400 today.
If you invested $1,000 in 1953 and stayed invested only when there was a Democratic president you would have $61,800 today.
If you invested $1,000 in 1953 and stayed invested regardless of who was president you would have $1,690,000 today.
Takeaway: The market doesn’t care who is president, and it’s better to stay invested rather than to trade in and out based on who is president.
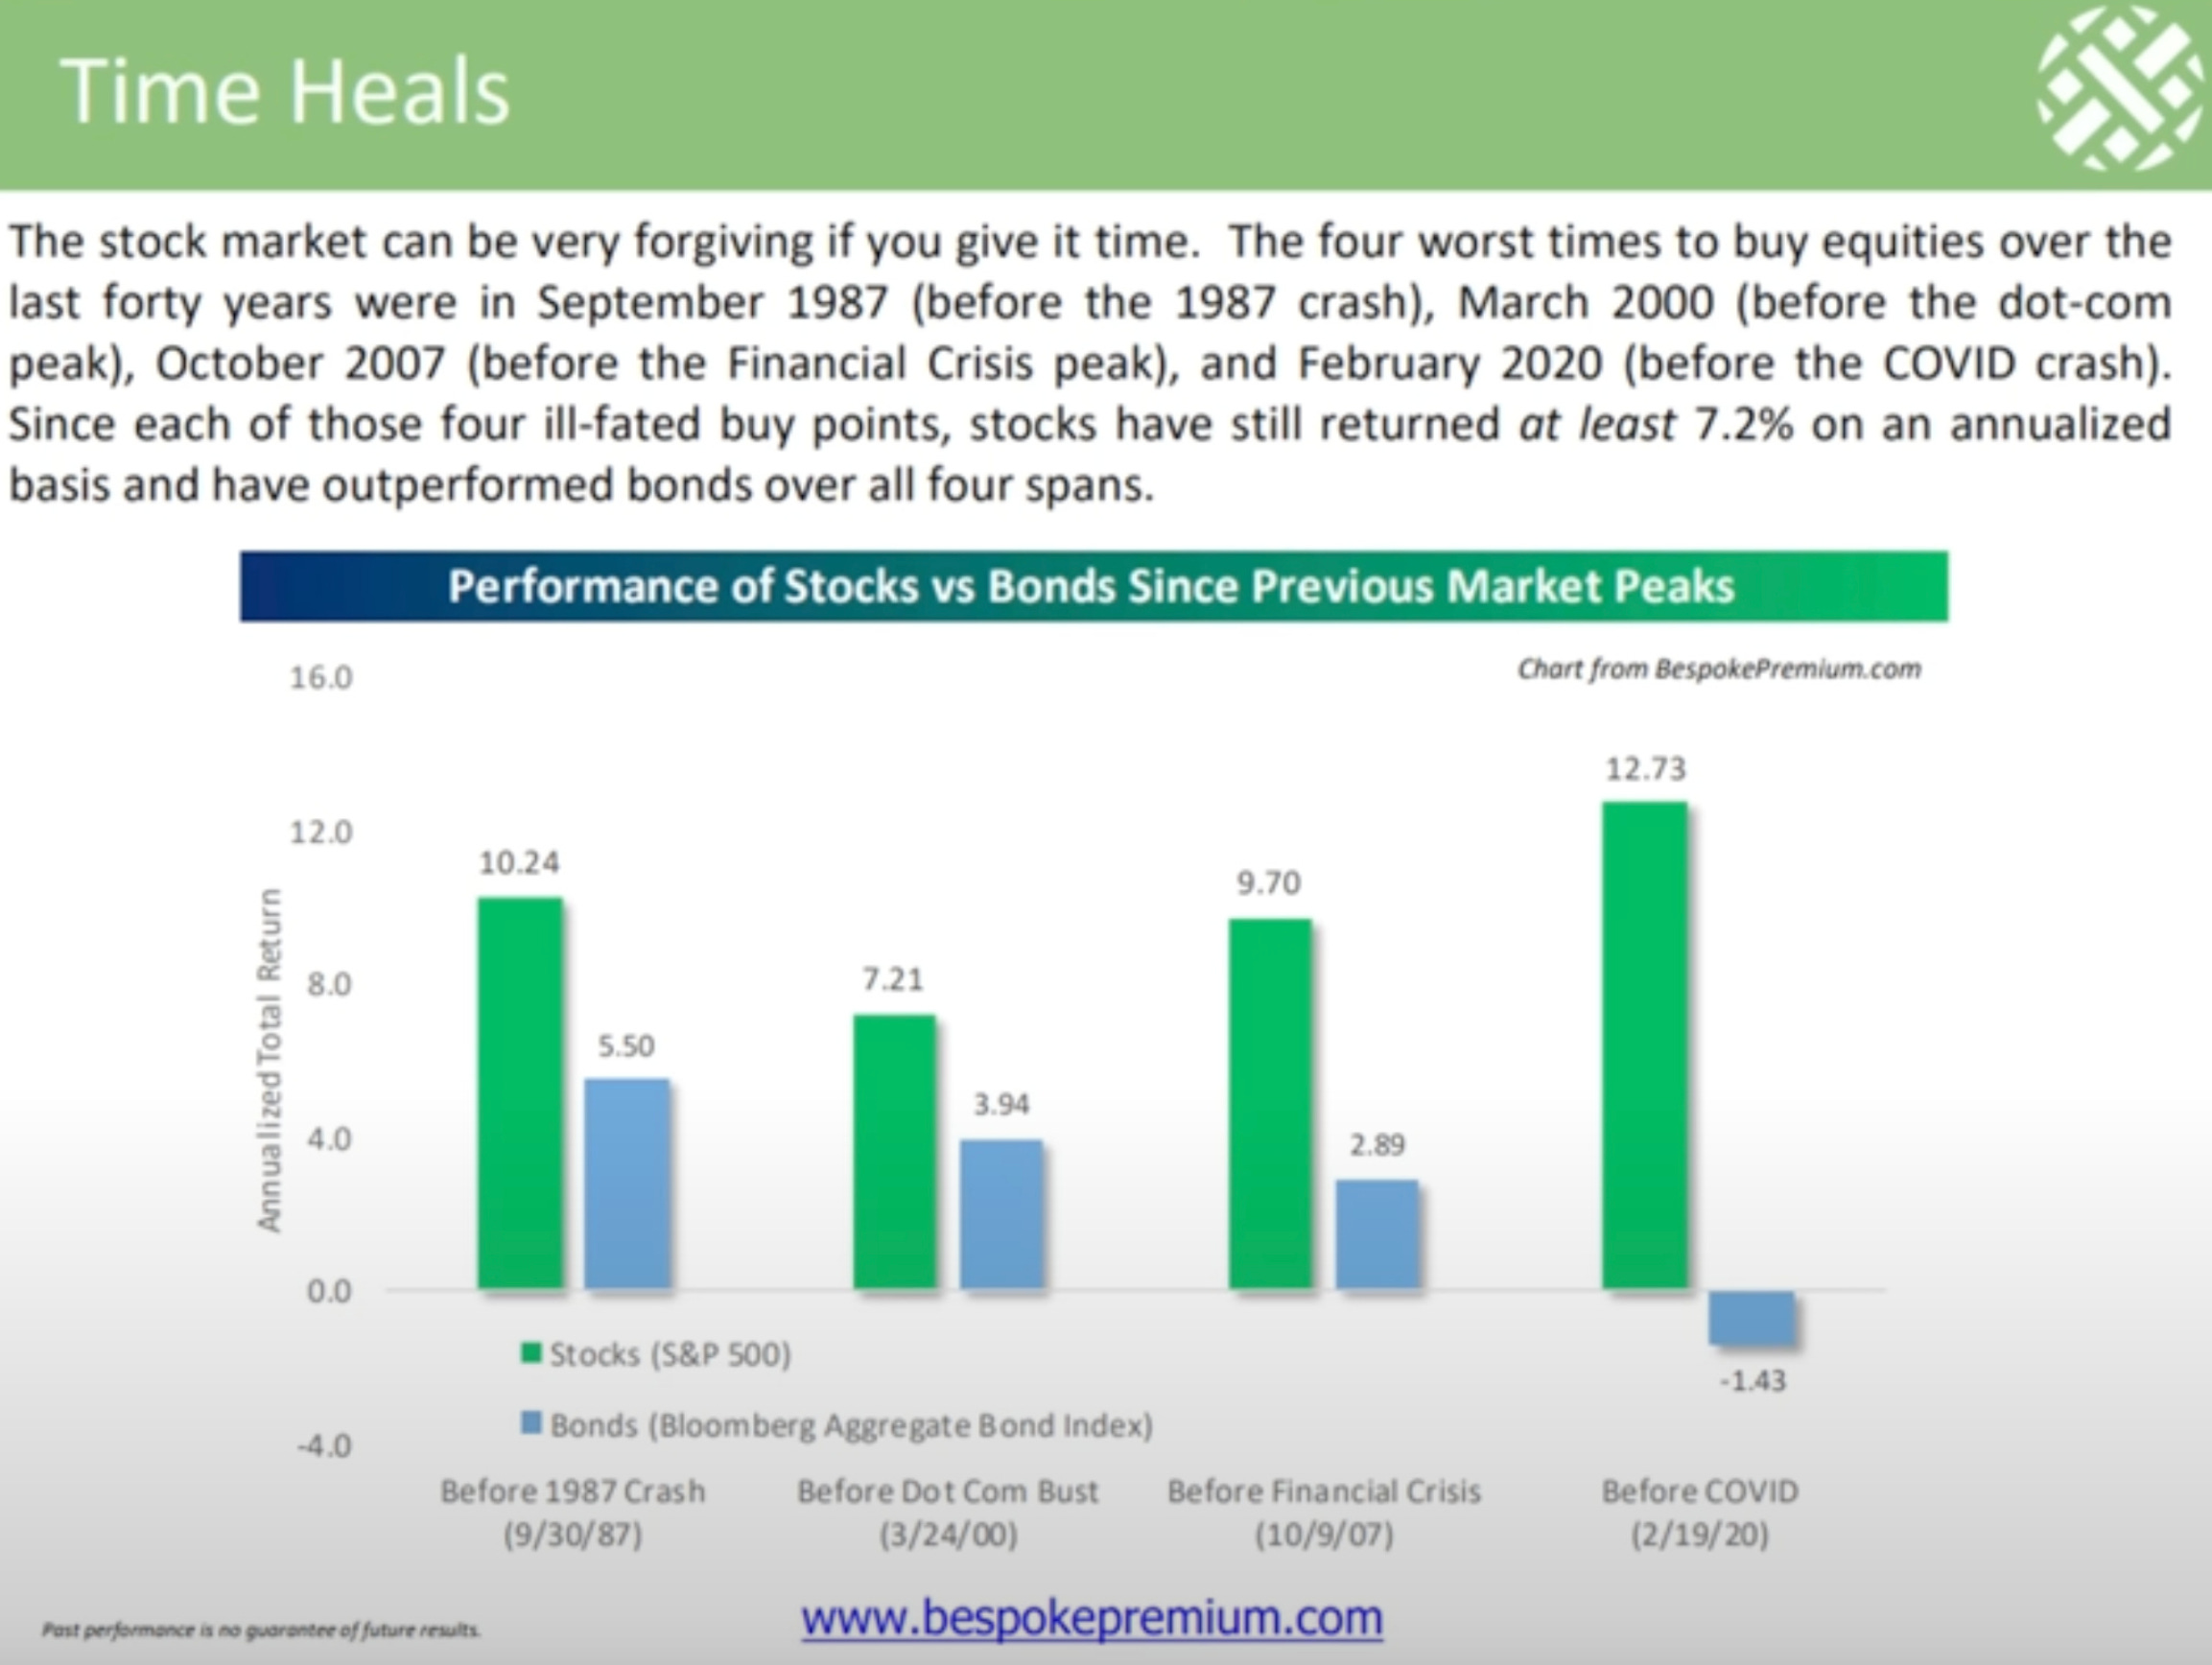
If you invested in stocks the day before the 1987 crash you would still have a +10.24% annualized return up until today.
If you invested in stocks the day before the Dot Com Bubble crash you would still have a +7.21% annualized return up until today.
If you invested in stocks the day before the Housing Crisis crash you would still have a +9.70% annualized return up until today.
If you invested in stocks the day before the Covid crash you would still have a +12.73% annualized return up until today.
Takeaway: It’s never a bad time to invest for the long term.
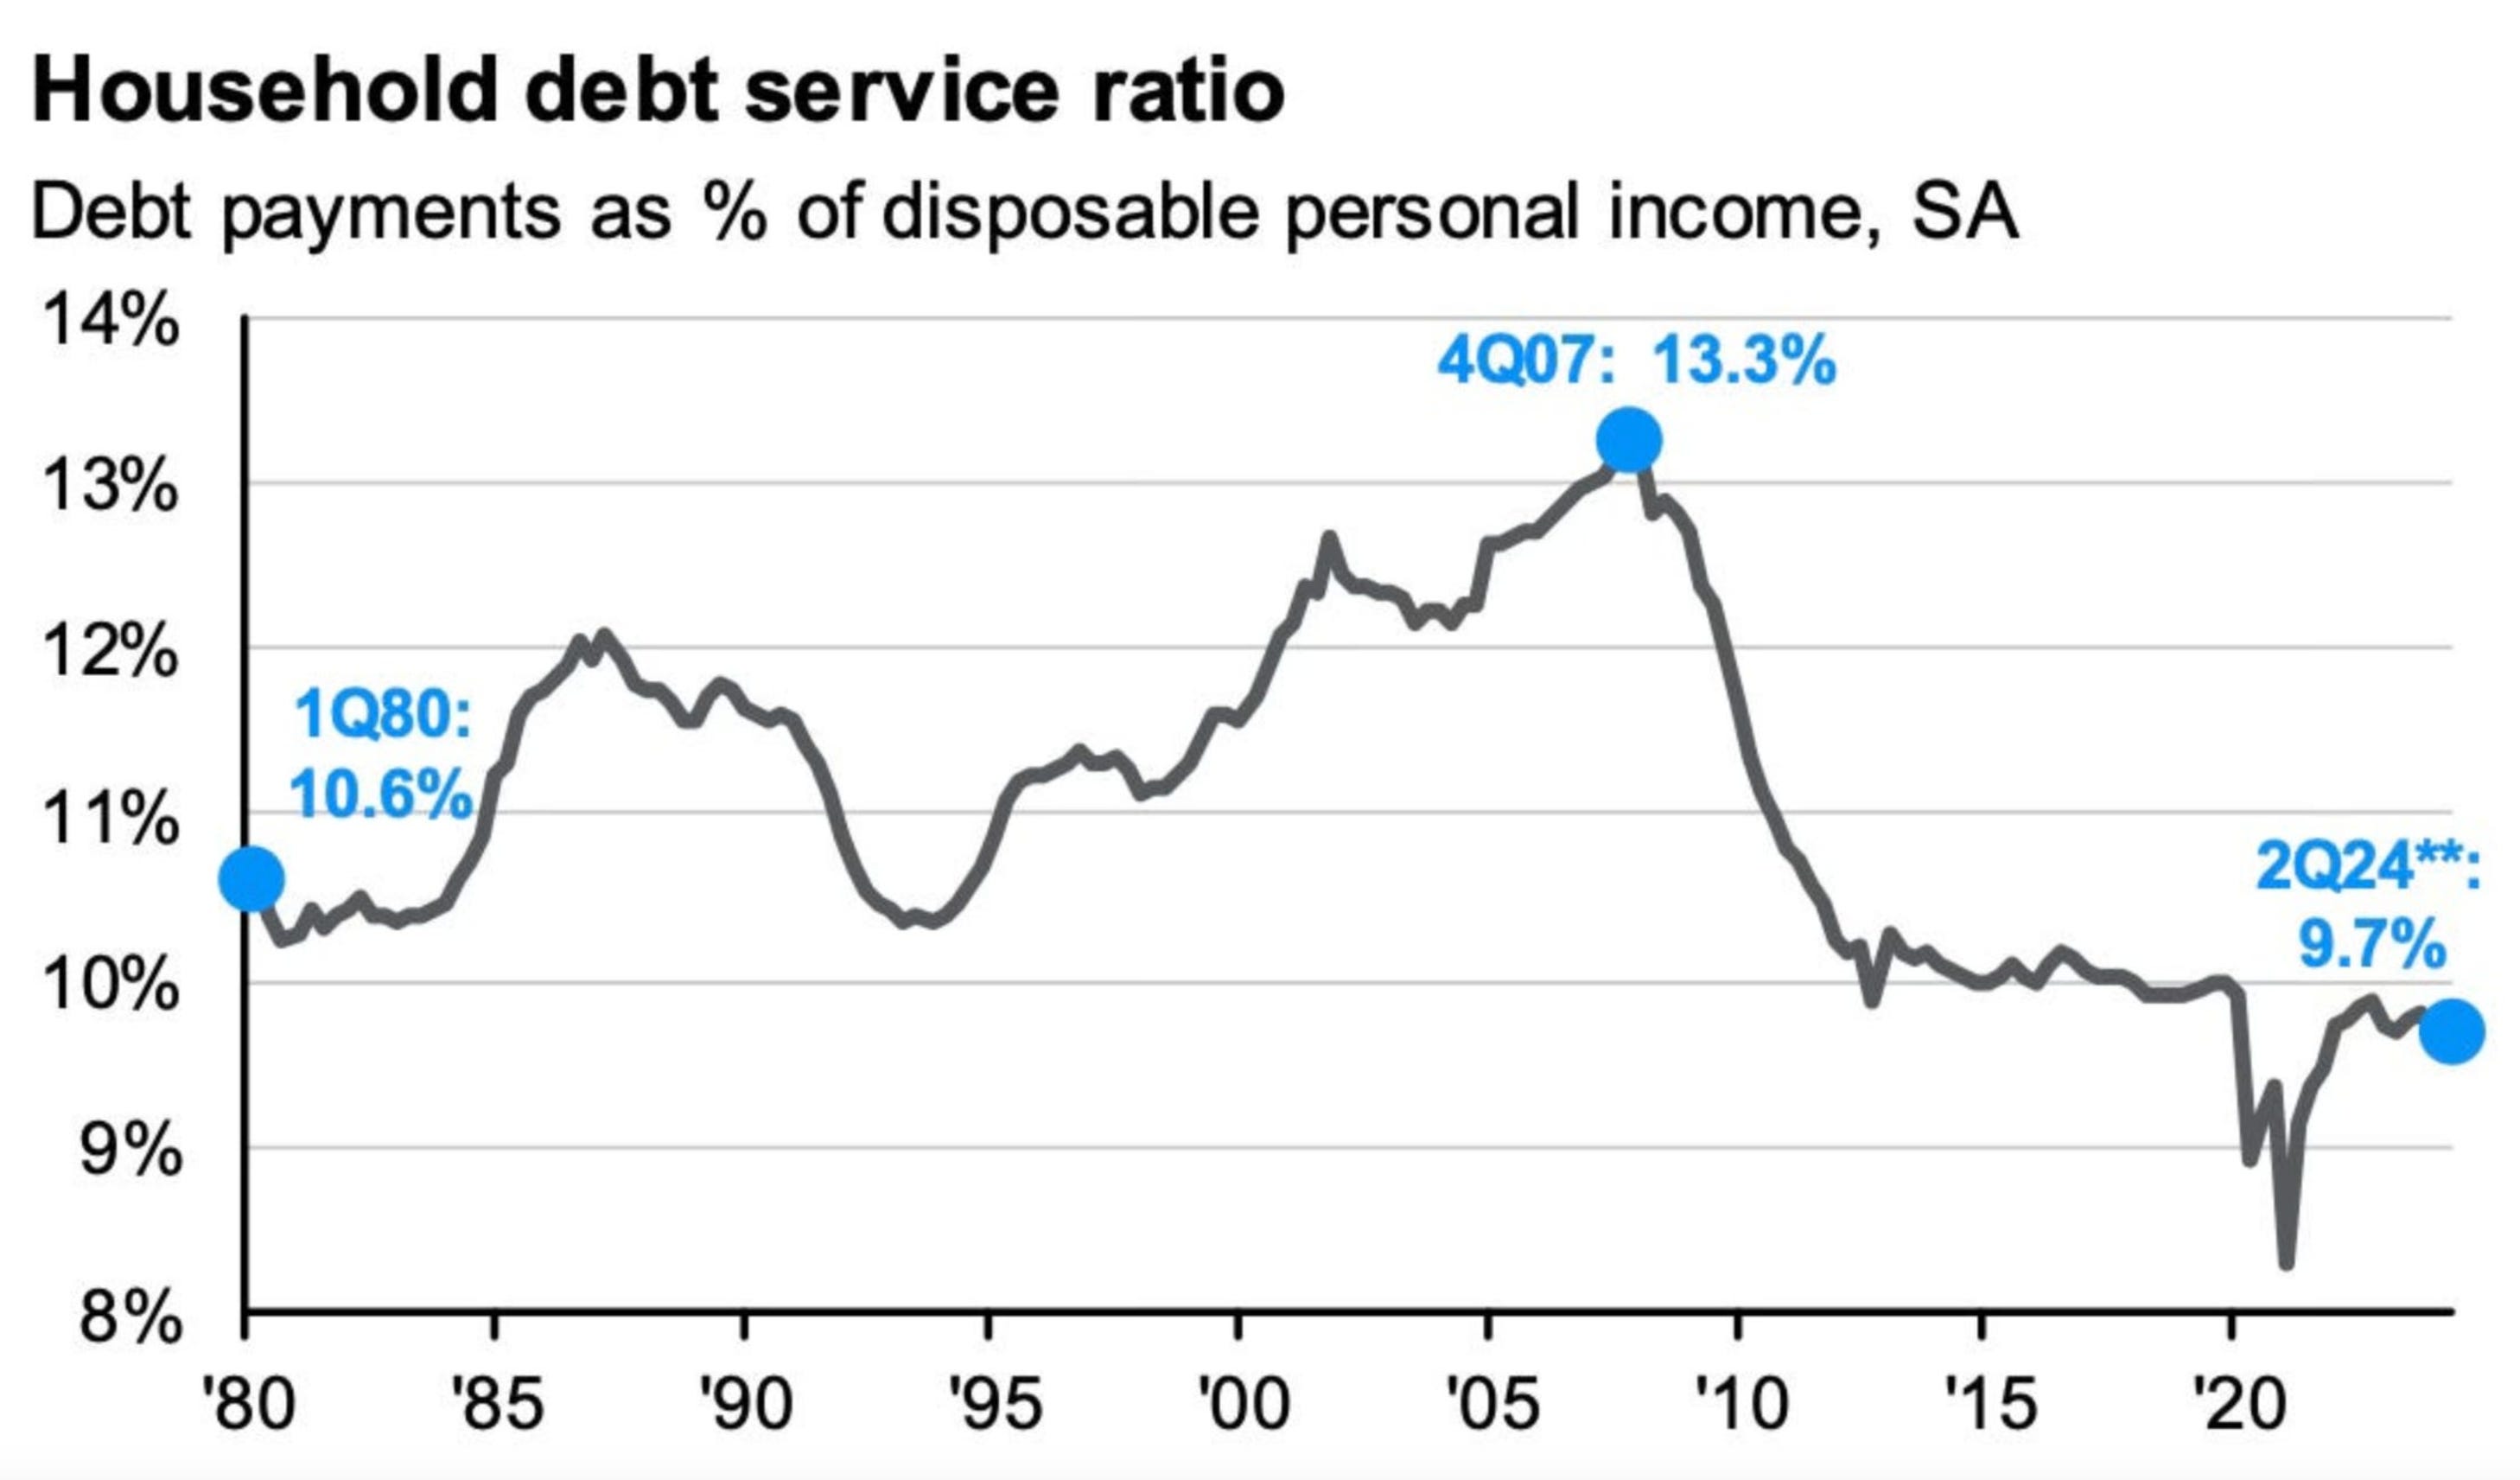
There’s a larger monetary value for household debt these days, but that household debt as a percentage of disposable income is currently at historically low levels based on data going back to 1980.
That means their debt is small relative to money they have available to spend.
Takeaway: The consumer isn’t in as much trouble or debt as the media or doomers would have you thinking.
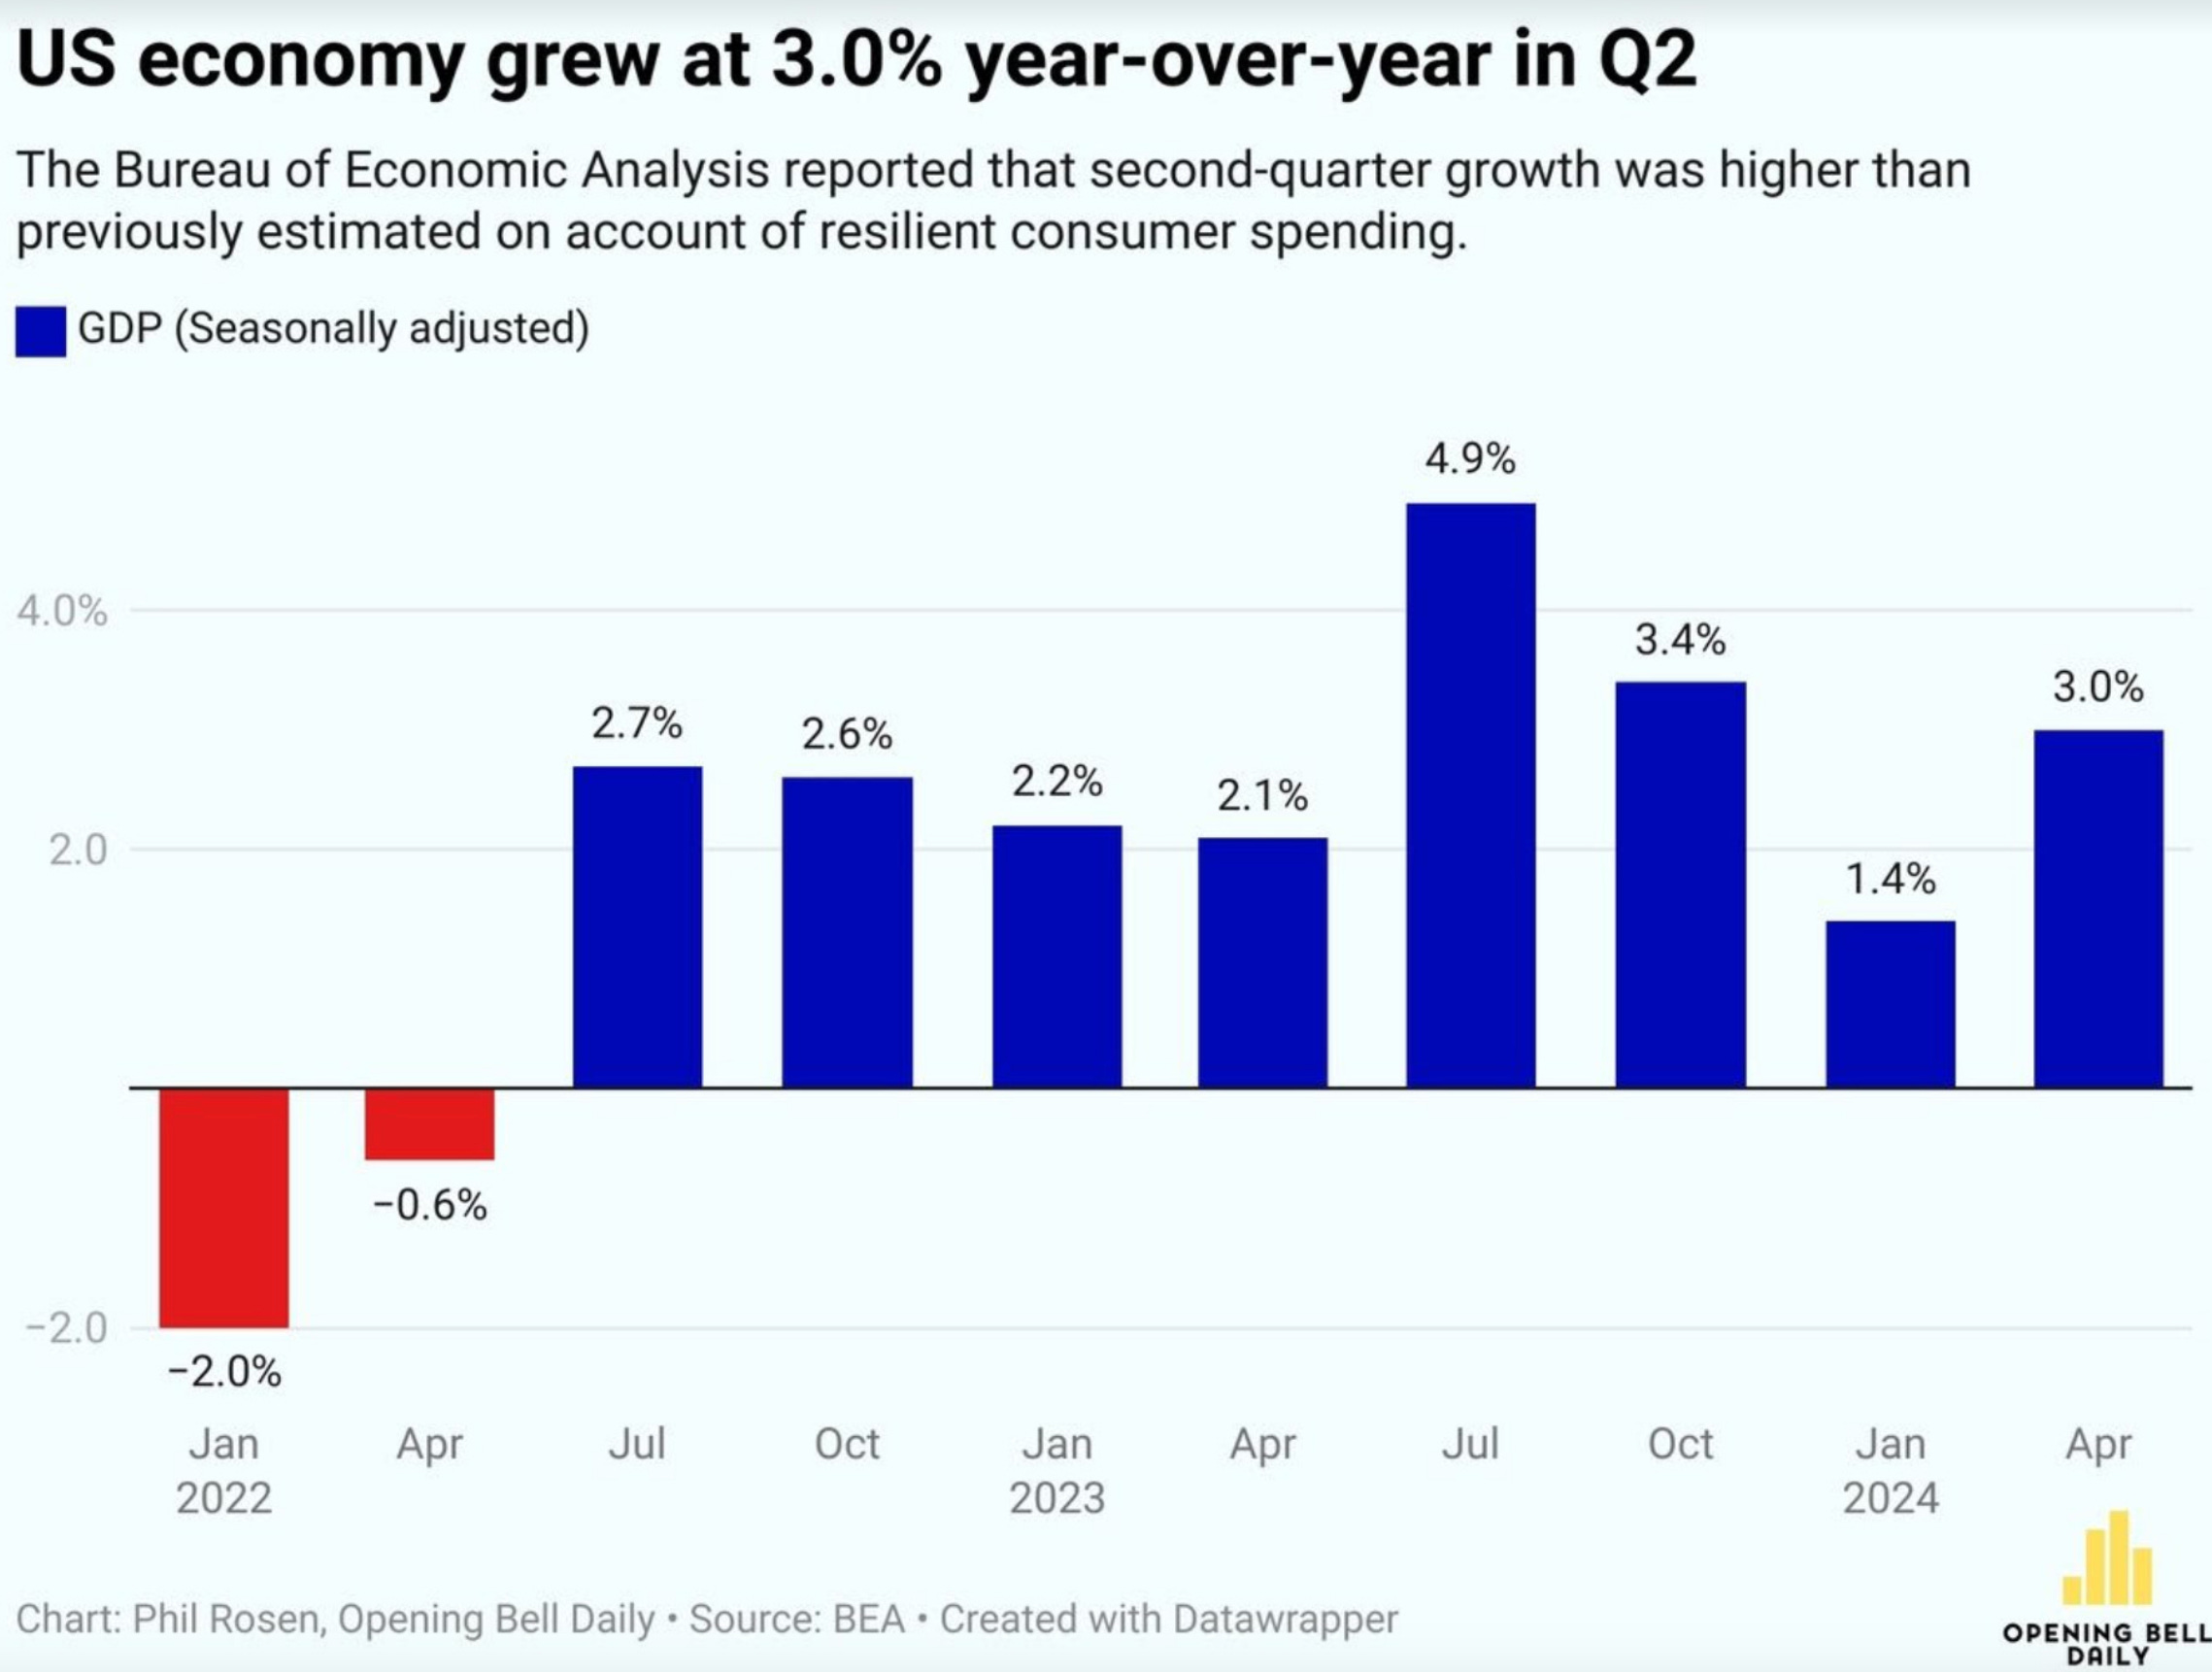
There was a 3% increase in year over year growth for the second quarter in the US, which is twice as much as the first quarter.
That means the economy is growing at a greater pace.
Takeaway: The economy growing more is a sign of a healthy economy rather than one in a recession.
I hope you enjoyed reading Simply Finance.
I’m just a small free newsletter writer, so if you enjoyed this post the best way to help me out is to share it with others!
And don’t forget to subscribe so you don’t miss the next edition!
Disclaimer: These are not recommendations and I am not a financial advisor. These are just my two cents, or two satoshis as the kids say. Remember to do your own homework before making any financial decisions. Also, keep in mind I usually have some personal investments in the things I discuss.

This is a great collection of data and insight Christos! This really highlights the importance of not getting swayed by short-term noise and sticking to a long term investment strategy. Gained a subscriber and I am looking forward to your next edition of My Stories!
I like the point about the high interest rates helping bigger companies. If the Fed decides to progressively lower interest rates, small caps will have a chance to outperform. Anyway, I invest mostly in dividend-paying ETFs so the Fed's decisions affect me minimally. Keep prospering, Christos.