How Does This Market Stack Up Against History
Charts & Chit Chat Comparing Present To The Past
Simply Finance — Giving you get a high level of Financial Data alongside relatable stories every week.
Let’s put some personality back in Finance.
Don’t be shy to hit the “like” button, share this post, and become a subscriber to this entirely FREE NEWSLETTER if you haven’t done so already!
Today’s edition is part of Charts & Chit Chat where I share Financial Data/Charts alongside quick takeaways that get right to the point.
My weekly Video Post will be next. I typically review these charts in more depth with that post.
And another edition of My Stories is typically after that. That’s a long forum post where I share vulnerable thoughts around my opinions in Finance.
For now, let’s look at some data and get right to the point.
Below is a recap of my favorite Finance visuals and notes over the last week.
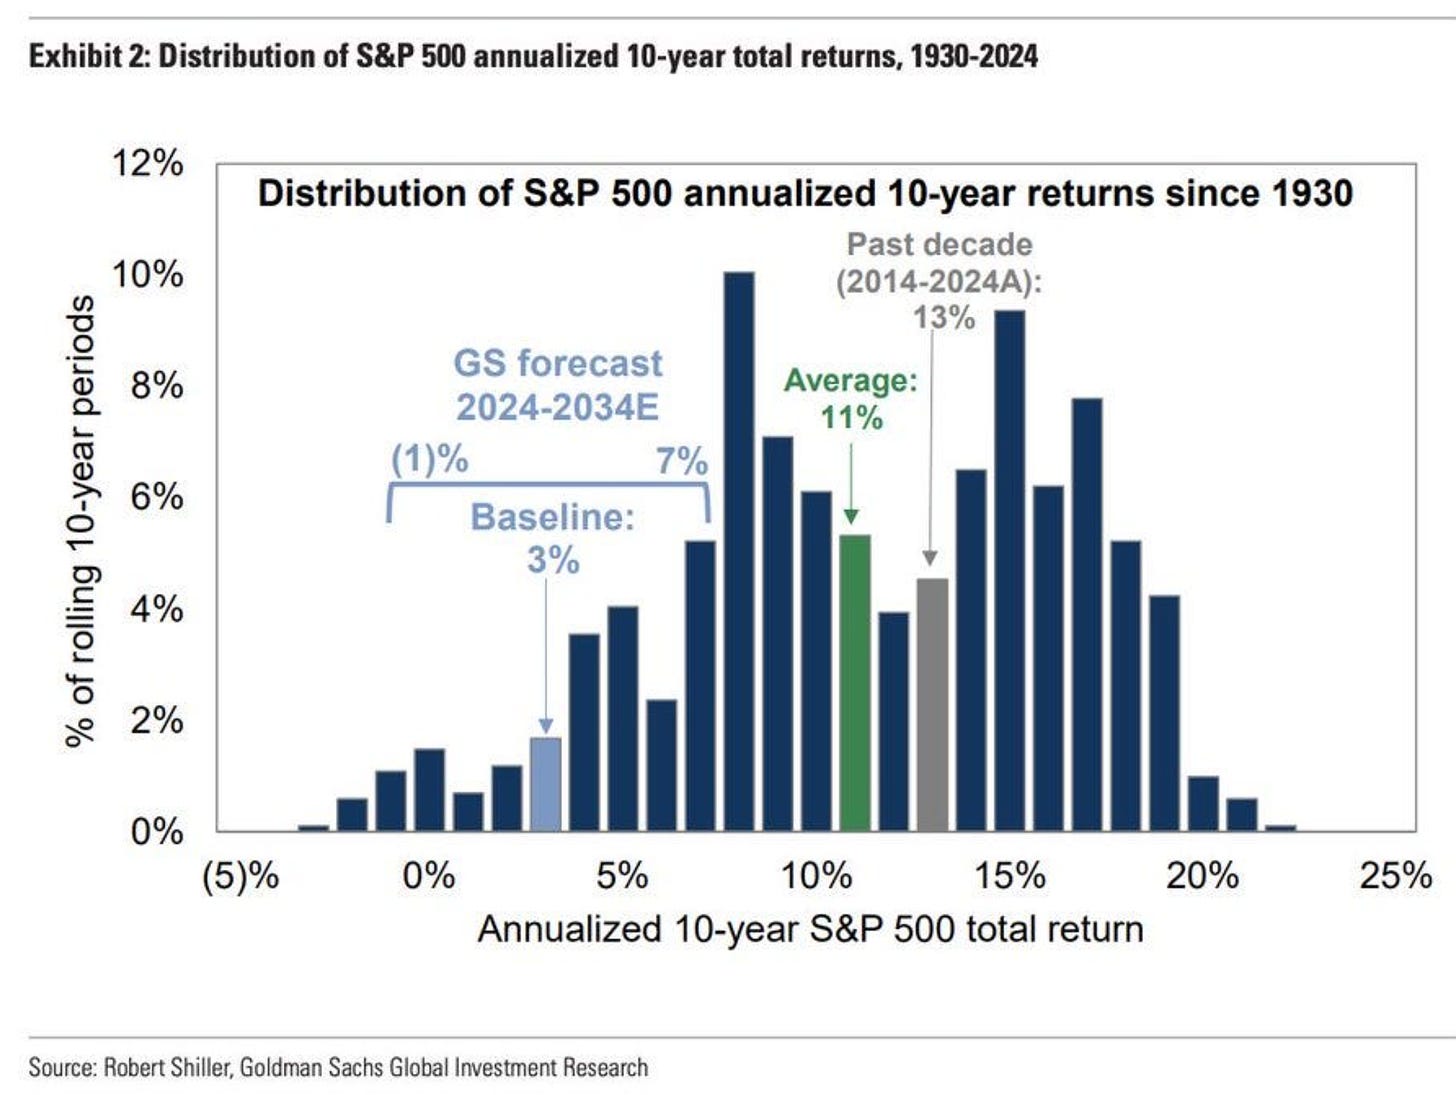
The average 10 year annualized return for the S&P 500 has been about +11% since 1930.
This past decade (2014 - 2024) has seen an annualized return of +13%. That’s higher than average.
Goldman Sachs is forecasting a lower than average annualized return over the next 10 years, at +3%.
I tend to disagree here.
I think the larger than average annualized returns have come because of running larger fiscal deficits as a percentage of GDP than normal, and I don’t see that trend stopping. I see it accelerating.
Takeaway: The larger than average returns over the past decade are scaring investors into thinking lower than average returns are around the corner.
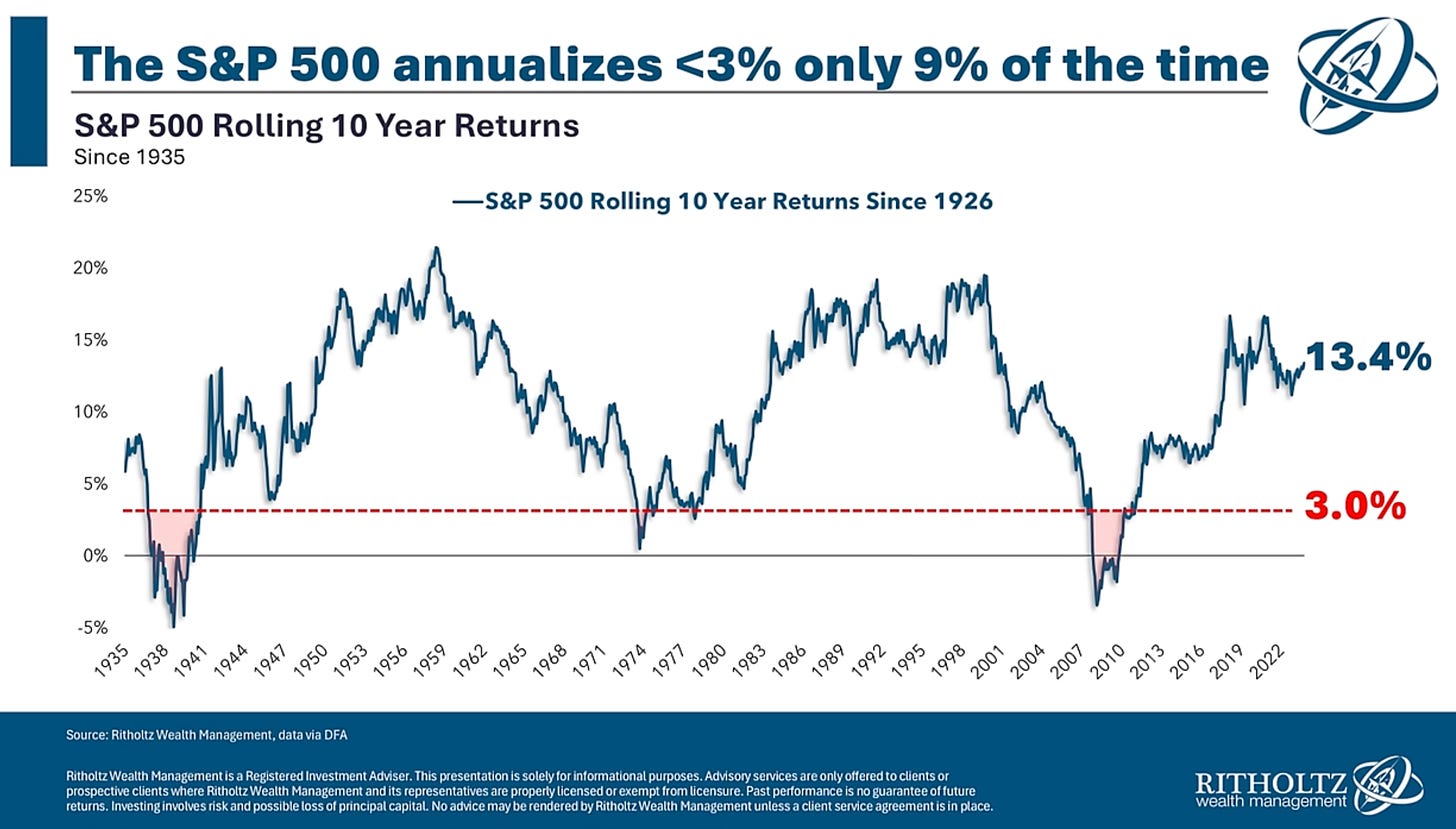
Since 1935, The S&P 500 has annualized at less than +3% over a 10 year period only 9% of the time.
That’s the shaded red regions on this chart. One is in the late 1930’s, and the other is around 2008.
Takeaway: It’s very rare that the S&P 500 has annualized returns at less than +3% over a 10 year period.
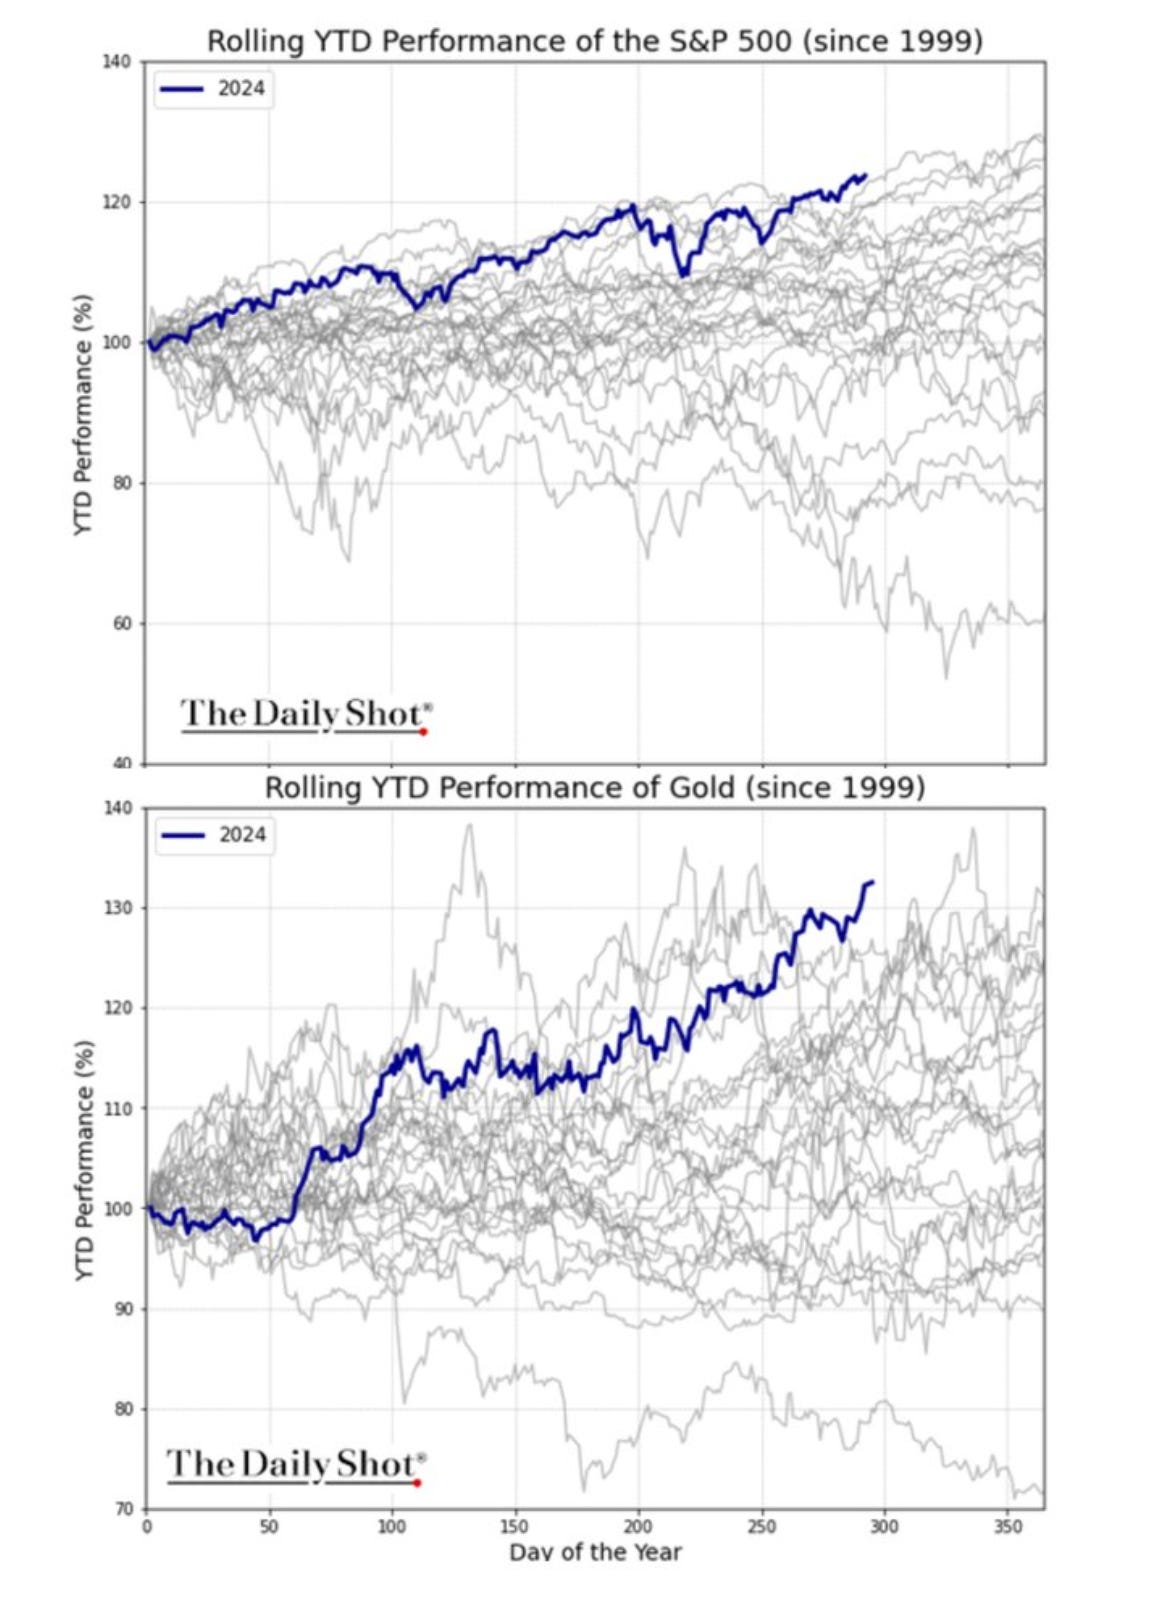
The S&P 500 (top chart) and Gold (bottom chart) are both having their best YTD starts in over 25 years.
Typically these two don’t happen at the same time.
This could be a sign that all assets are becoming more correlated these days, and are moving higher together as the government continues debasing the dollar exponentially.
For example, Paul Tudor Jones, one of the best traders to ever live, recently called Bitcoin, Gold, and the Nasdaq all “inflation hedges.”
Takeaway: Stocks and Gold are both performing very well this year and could be becoming more correlated to each other over time.
The forecasted earnings growth for the Mag 7 is astronomically higher than the other 493 companies in the S&P 500 combined.
Stock prices are driven by earnings growth. Theoretically, the larger the earnings growth the higher the stock’s price should go.
Takeaway: The reason the Mag 7 outperforms the other 493 companies is not because of hype. It’s because they had much larger earnings growth.
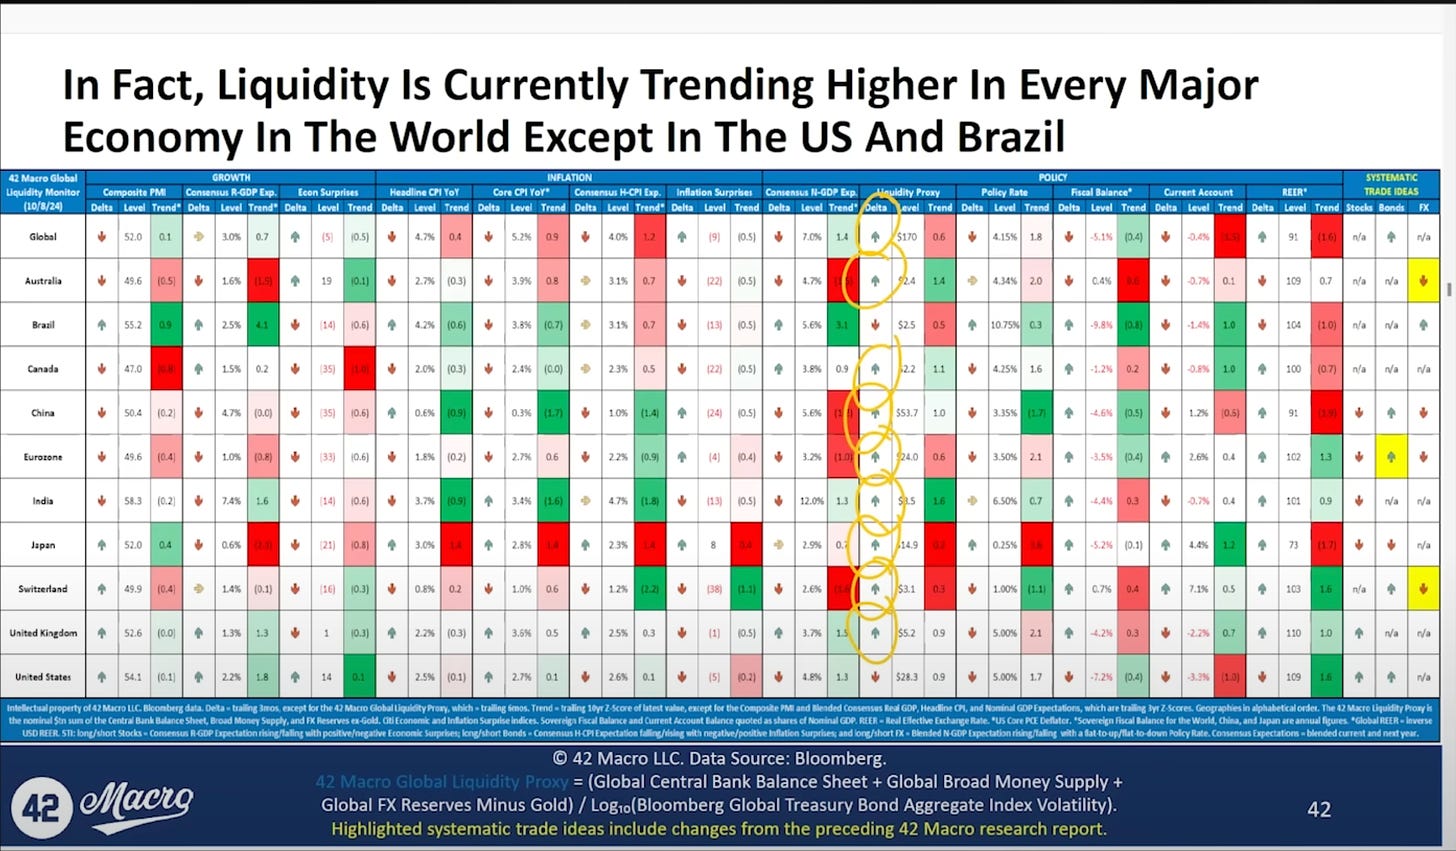
There are several ways to measure liquidity, and every company that provides research for institutional clients has their own specific criteria.
As of a couple weeks ago, the 42 Macro Liquidity Metrics showed that liquidity is currently trending higher in every major economy in the world except for in the US and Brazil.
I’ve seen a lot of other research to suggest liquidity is just starting to rise in the US over recent months.
In any event, 42 Macro also does believe liquidity in the US is coming soon.
Global liquidity increasing is a tailwind for asset prices, especially in the US.
Takeaway: Most of the major economies in the world are increasing liquidity, and the US (biggest one) is just getting started.
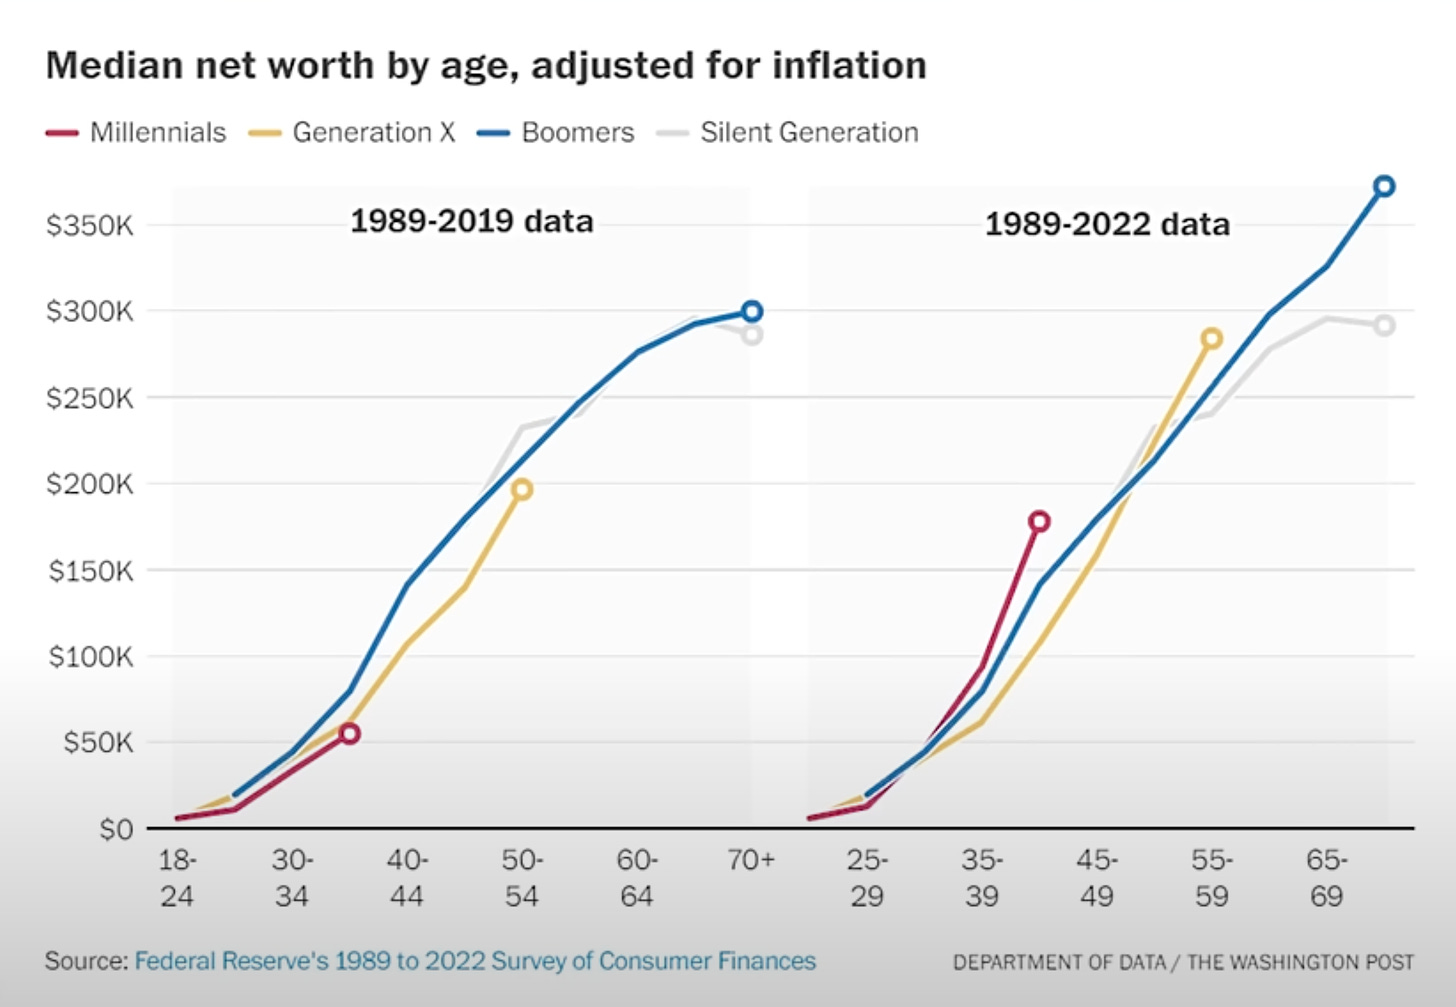
This chart show the median net worth (vertical column on the left) by age cohorts (horizontal column on the bottom).
Millennials (red line) increased their net worth the most rapidly out of all generations since 2019.
You can see the red line flips from the shallowest line on the left chart to the steepest line on the right chart.
Millennials are notorious for embracing risk like tech stocks, cryptocurrency, and 0DTE options. Maybe the risk is paying off?
Takeaway: Millennials are being rewarded for the risks they are taking.
The A16Z State of Crypto Report shows us the evolution of the costs involved to send money internationally.
Wire transfers cost about $44.
USDC is a stablecoin. It’s a US Dollar on the blockchain. Each digital dollar is backed by a dollar equivalent.
In 2021 you could send USDC on Ethereum for a $12 fee.
In 2024 that average fee was brought down to $1.
Today in 2024, that average fee was brought down to less than $0.01 with the help of “layer 2" blockchains” working on top of Ethereum.
Takeaway: Maybe this blockchain thing really is disruptive technology and actually does have a use-case to better the world.
Stablecoin activity (black line) continues to grow even when the spot crypto trading volumes (blue bars) are decreasing or low.
It only makes sense, given it has never been easier or cheaper to send money anywhere in the world at any time of the day or night.
Takeaway: Stablecoin demand continues to rise, which is beneficial for blockchains and the demand for the US Dollar in general.
American Express showing credit card holders with debt that is 30 days past due (left chart) has been below pre-pandemic levels since Quarter 3 of 2023.
“Net Write Offs” (right chart) are debts that the company deems uncollectable, and the story is the same there.
Takeaway: Credit card delinquencies remain low.
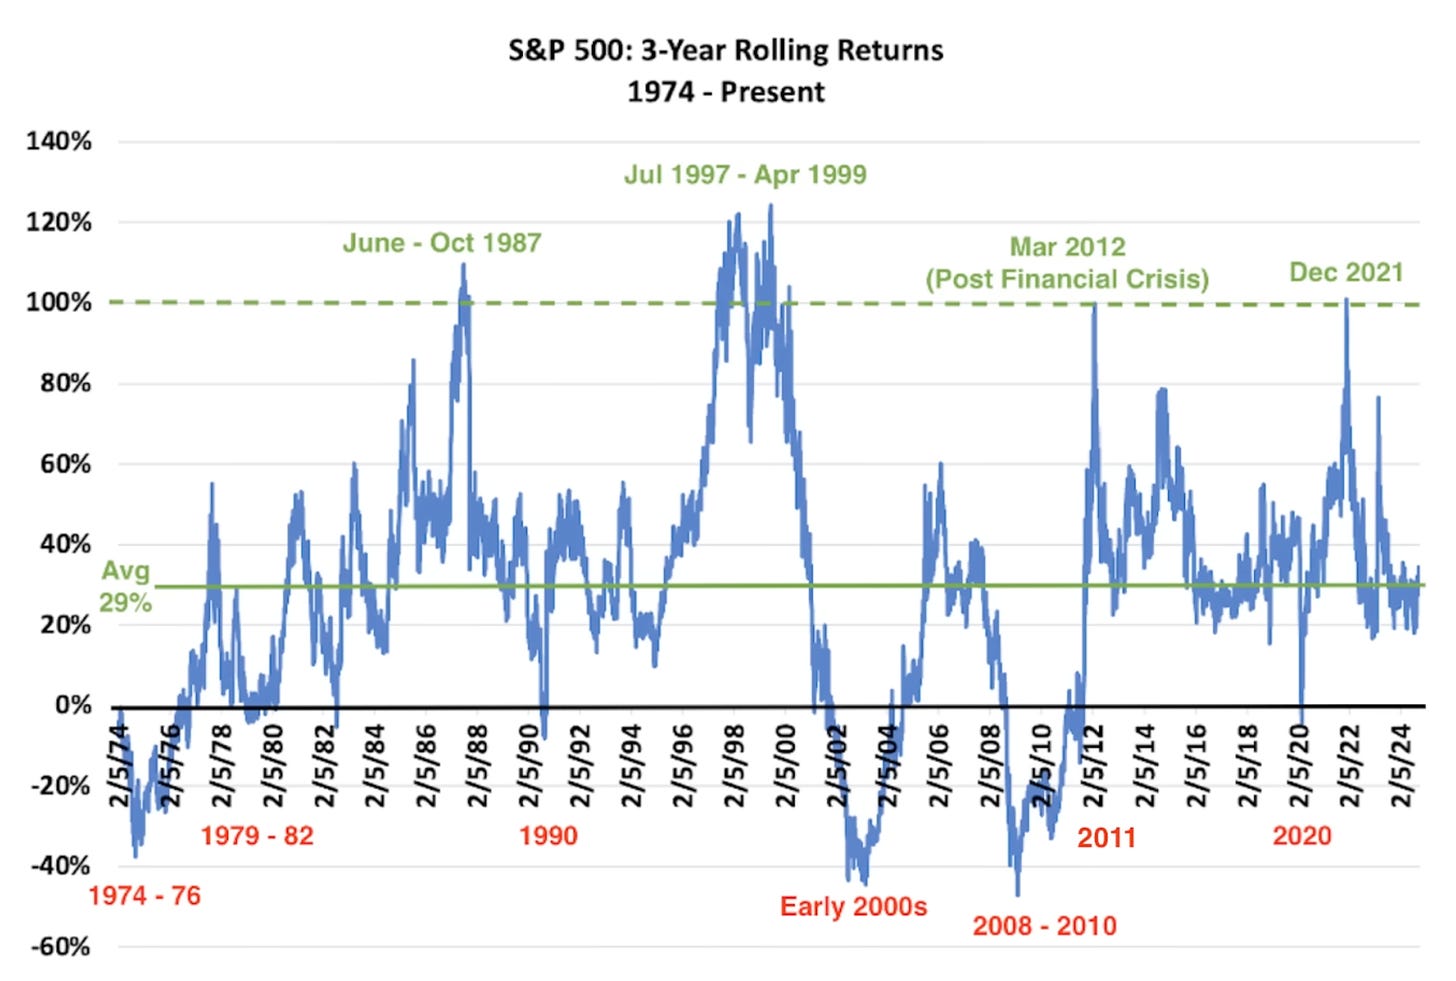
The 3 year rolling returns for the S&P 500 are currently right at the long term average of +29% (solid green line).
It’s usually not until the rolling 3 year returns for the S&P 500 are closer to +100% when we tend to see pullbacks.
We’ve seen those +100% returns in a 3 year period four different times since 1974, and we’re nowhere near it at the moment.
Takeaway: The S&P 500 is showing average returns that are not in “bubble territory” based on the last 3 years.
The 3 year rolling returns for the Nasdaq are currently below the average of +40% (solid green line).
It’s usually not until the rolling 3 year returns for the Nasdaq are over +100% when we tend to see pullbacks.
Takeaway: The Nasdaq has been underperforming the average 3 year rolling returns and is still playing catch up.
I hope you enjoyed reading Simply Finance.
I write a small FREE NEWSLETTER here, so if you enjoyed this post the best way to help me out is to share it with others!
And don’t forget to subscribe so you don’t miss the next edition!
Disclaimer: These are not recommendations and I am not a financial advisor. These are just my two cents, or two satoshis as the kids say. Remember to do your own homework before making any financial decisions. Also, keep in mind I usually have some personal investments in the things I discuss.


