

Charts & Chit Chat: 16 Finance Visuals to Inspire Action
Charts & Chit Chat: 16 Finance Visuals to Inspire Action
Inflation, Compounding Returns, Market Health, And More!

Simply Finance is here to decode the financial matrix for you. Join our community for simple breakdowns of complex topics and empower your financial journey.
Don’t be shy to hit the “like” button, share this post, and become a subscriber to this entirely FREE NEWSLETTER if you haven’t done so already!
Our last post had a lot more words and focused on how Overanalyzing Investments Leads To Underperformance.
This post has less words and more pictures, alongside short notes to get right to the point.
Let’s Dive In!
Below is a recap of my favorite Finance visuals and notes over the last week.
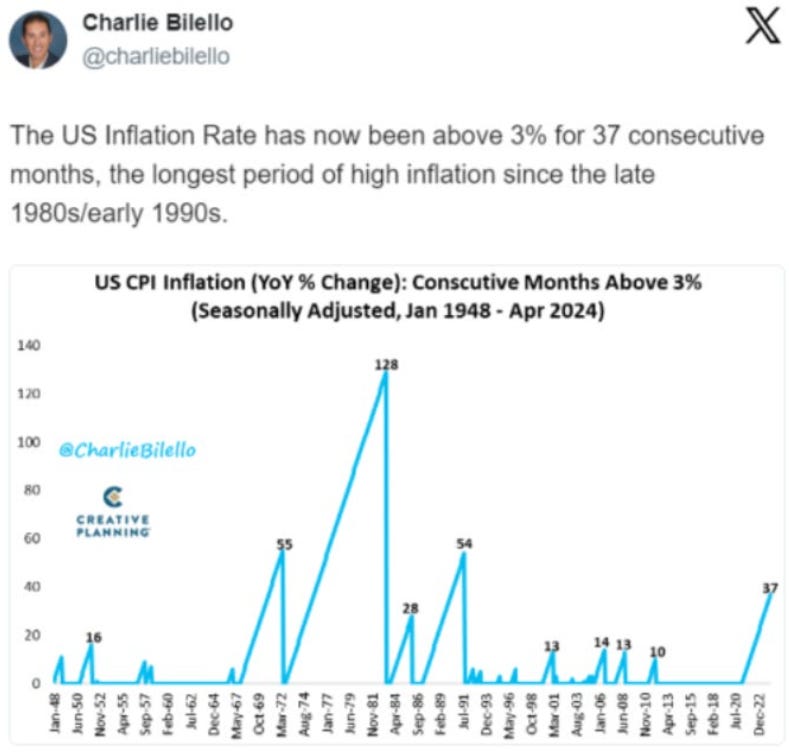
Imagine if we had a crystal ball and knew that this would be a headline 37 months ago.
I don't think anyone would have bet the market indexes would be making new All Time Highs with it.
Takeaway: The economy and the markets are too complex for one data point to rule them all.
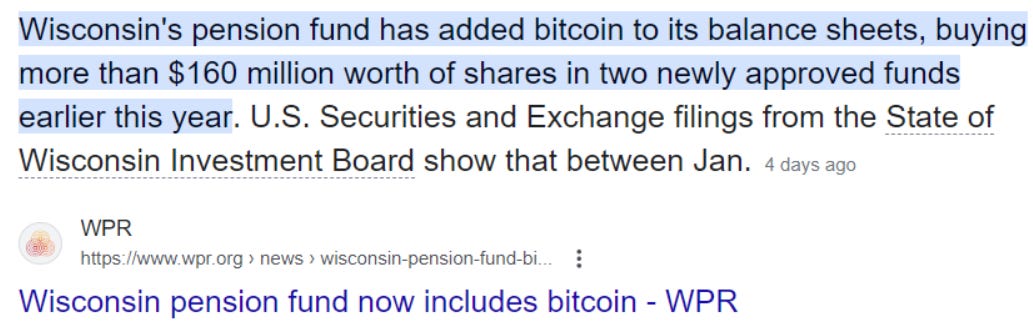
With about $156 billion in assets in the Wisconsin Pension Fund this $160 million Bitcoin allocation is just 0.06% of their assets under management.
Today they dip their toes in with 0.06%. Most will end up with a 1-5% allocation over time.
Takeaway: Institutions are coming and game theory is just starting.
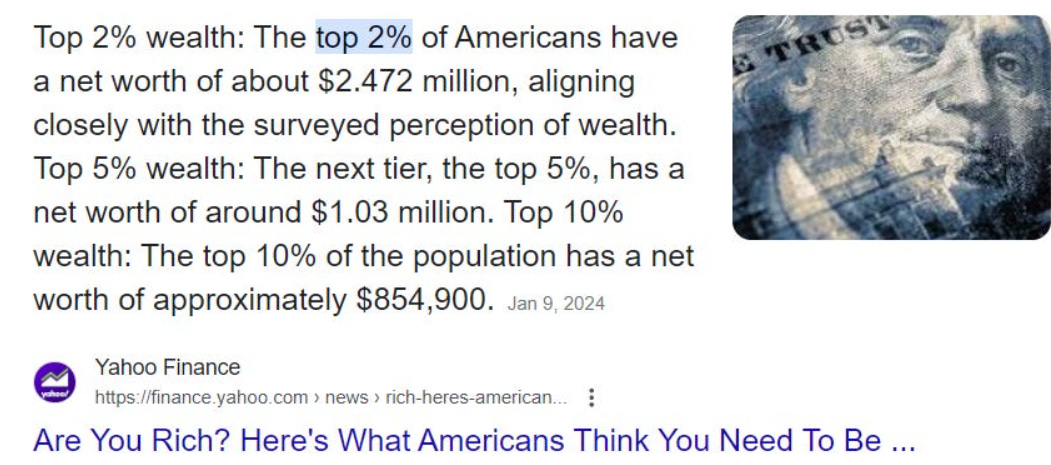
$10k invested every year for 10 years with a 20% annual return turns into $2.6 Million Dollars.
That would put your wealth in the top 2% of Americans.
Even if you discount the returns by half as much you will still be in the top 5% of Net Worth in America.
Takeaway: Become a student of markets and play the long game.
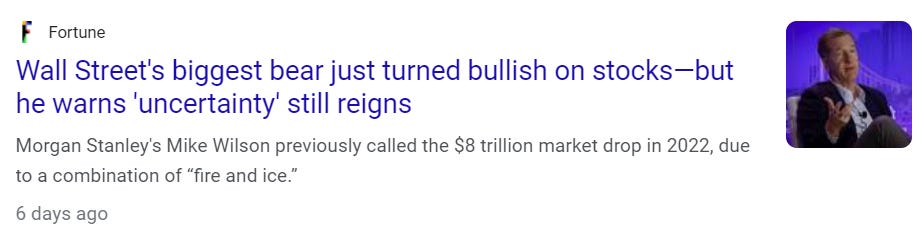
This analyst had a target of 4500 on the S&P's at the start of the year when the S&P's were at 4830.
A pullback down to 4500 would have been about -7%.
Now as the S&P's are up +11% on the year he has turned bullish.
Someone trading like that would have missed out on +11% in the S&P's because they were scared of a -7% drawdown that never happened.
The irony. The agony. The audacity.
Takeaway: Following targets set by Wall Street Analysts is a sure way to lose money over time.
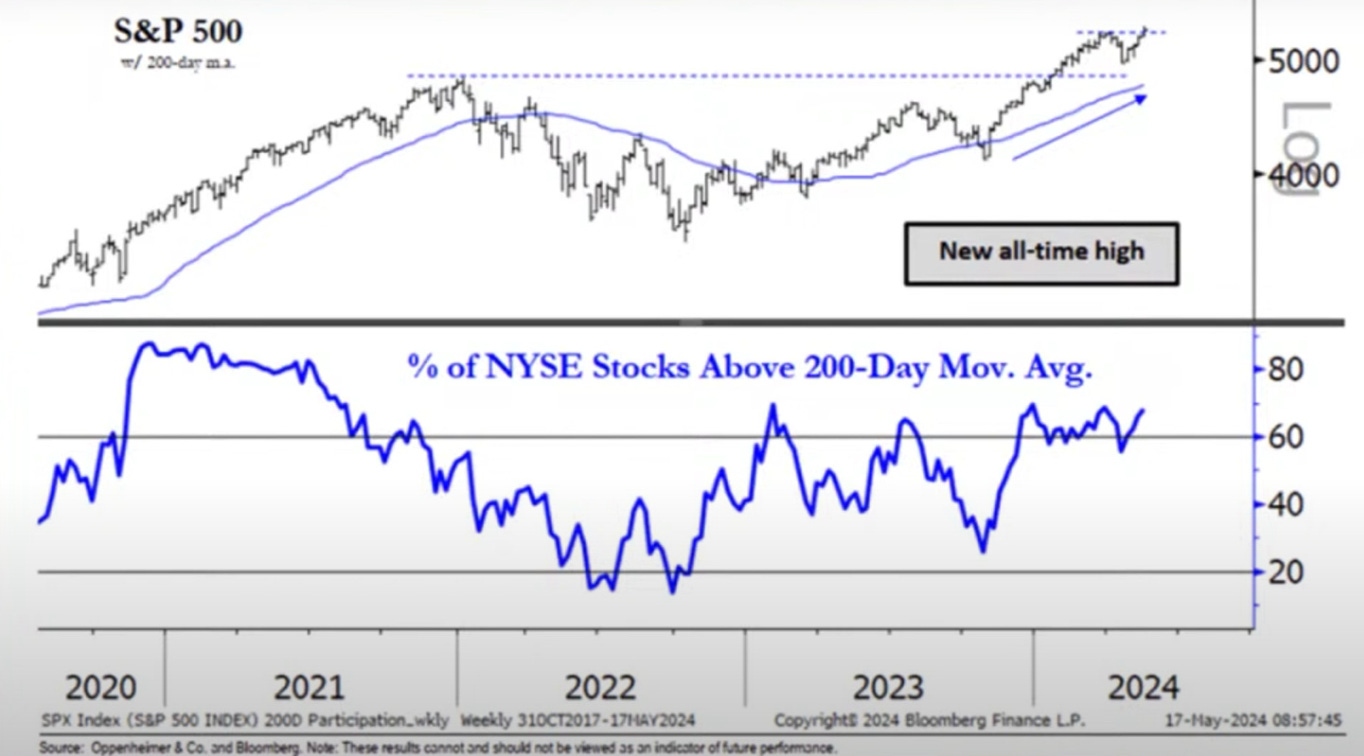
I like this chart that shows the percentage of stocks above their 200 Day Moving Average.
Notice how each time we crossed over the 60% line over the last few years the S&P’s continued higher for much longer.
We continue to hold above the 60% line, and we’re not nearly as overvalued as we’ve seen in the past.
Takeaway: This leaves more room for the S&P’s to move higher from here.
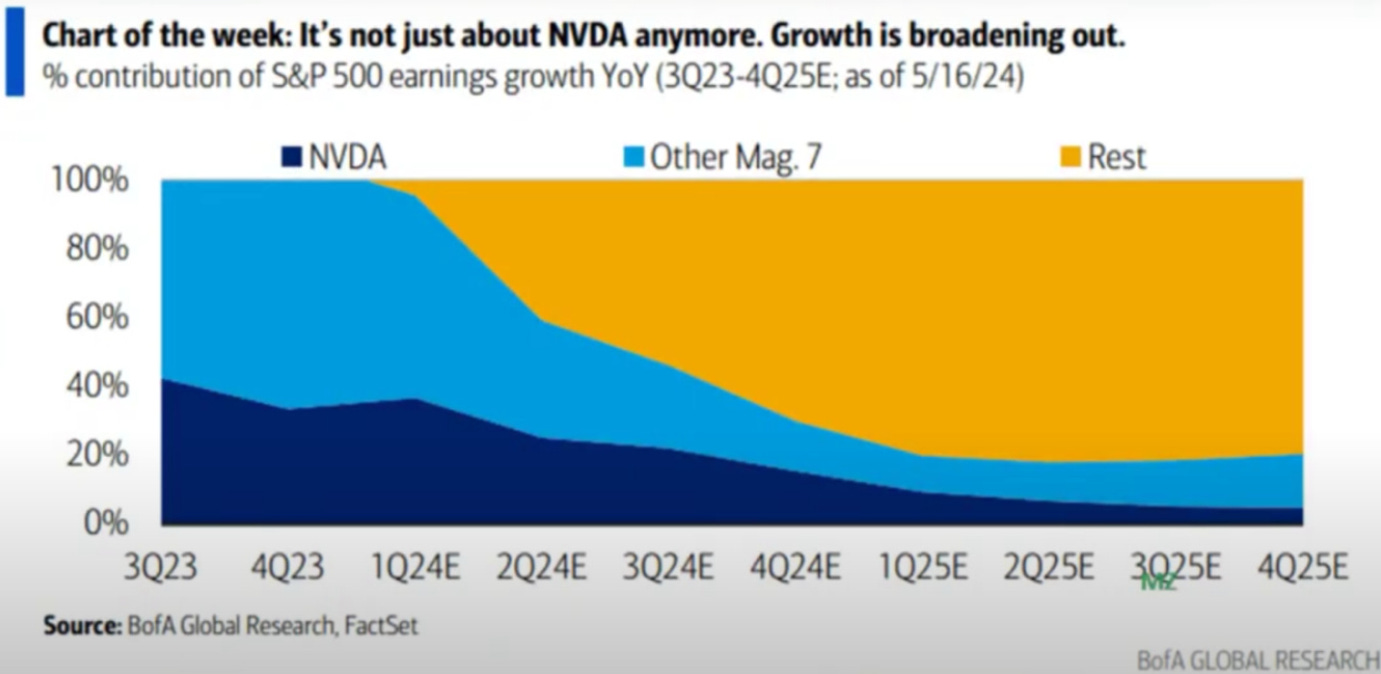
While permabears continue to bang the table about how it’s just NVDA and/or the Mag 7 stocks that are leading this market higher — the facts say otherwise.
This reminds me of the old market adage, “do you want to be right or do you want to make money?”
Takeaway: More stocks besides the Mag 7 are participating in the stock market rally higher.
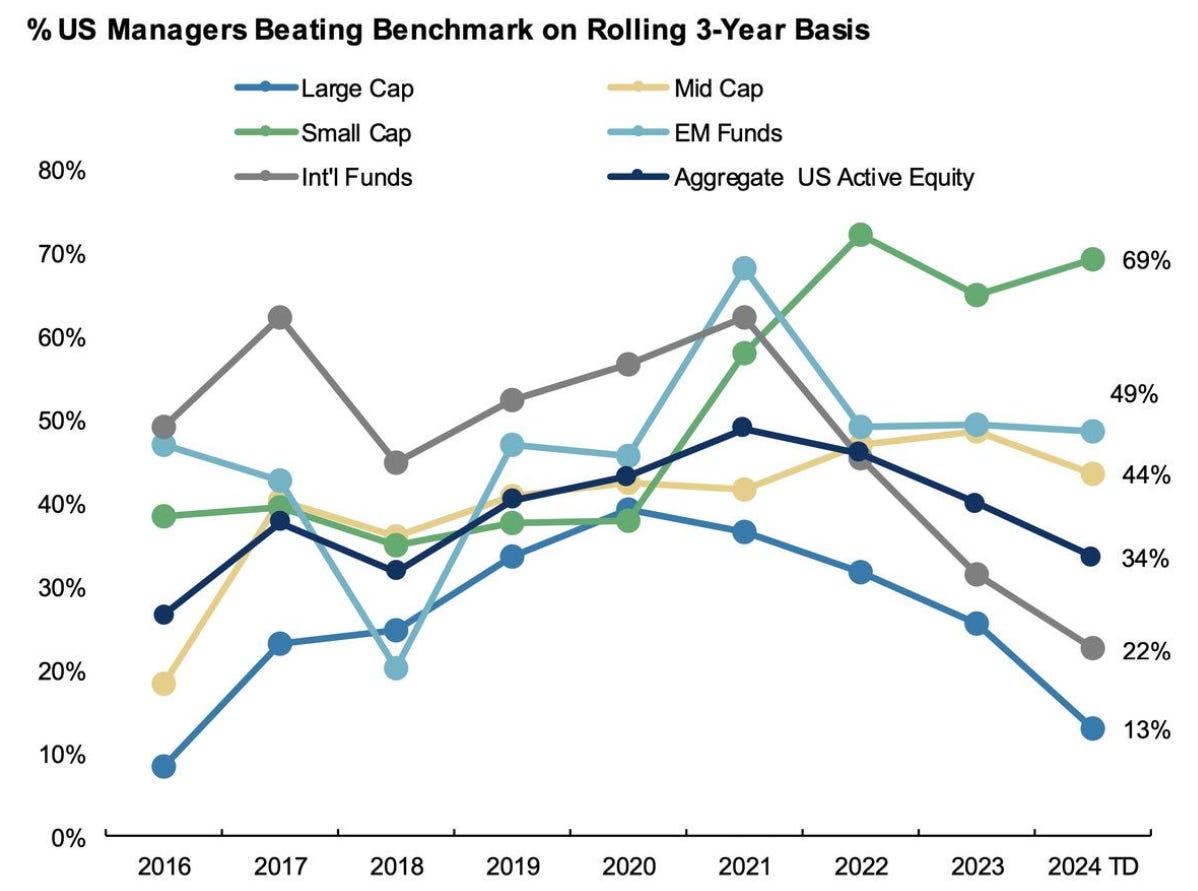
At best, only 40% of Fund Managers have been able to outperform the S&P 500 in a rolling 3 year basis since 2016.
It boggles my mind how there is a trillion dollar fee industry created on underperforming the benchmark.
Takeaway: You must learn how to take control of your own financial future. Wall Street can’t save you.
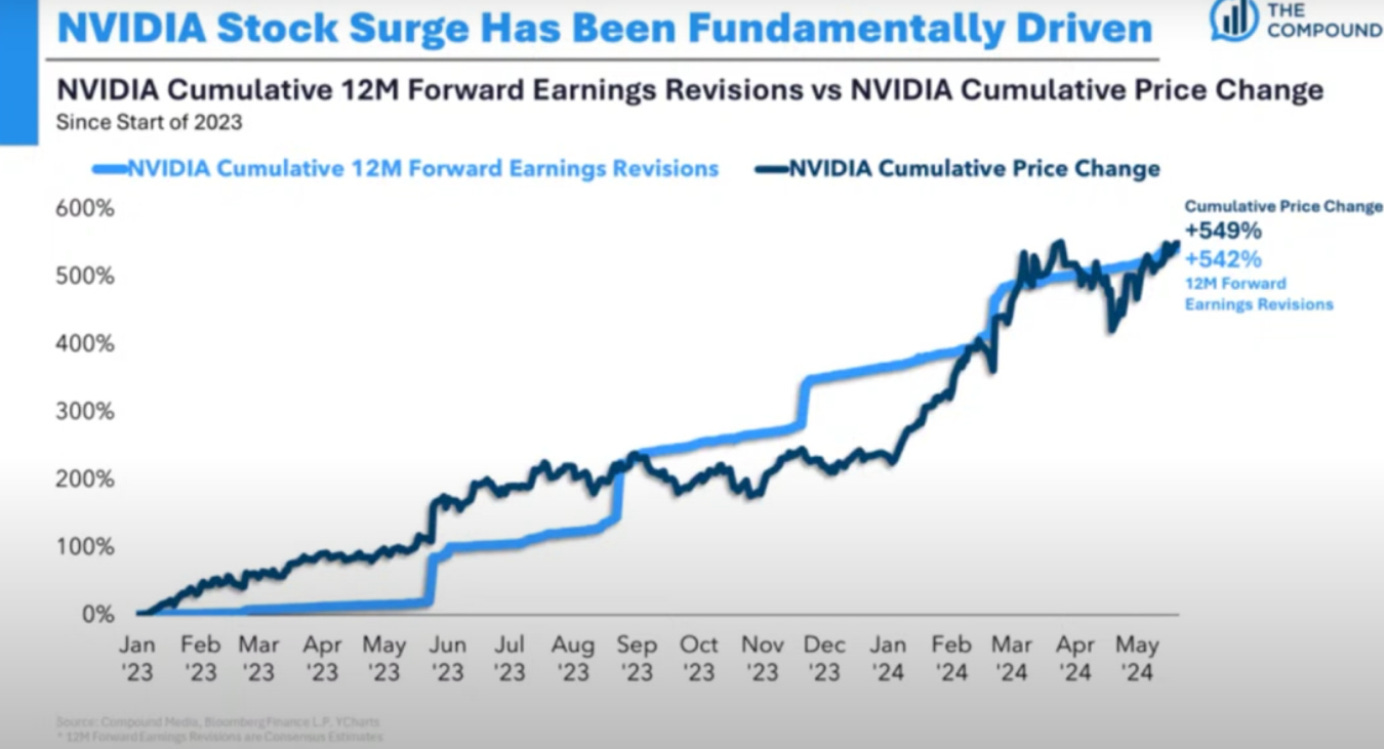
Forward earnings in NVDA 0.00%↑ match the stock’s price moving higher.
Just because the stock is up a lot doesn’t mean it can’t go higher.
The gains are justified when we’re talking about a company quadrupling growth.
Believe it or not, NVDA 0.00%↑ is increasing their sales and net income faster than their stock price is increasing.
Takeaway: The growth is real. It’s not a fad. AI is here to stay.
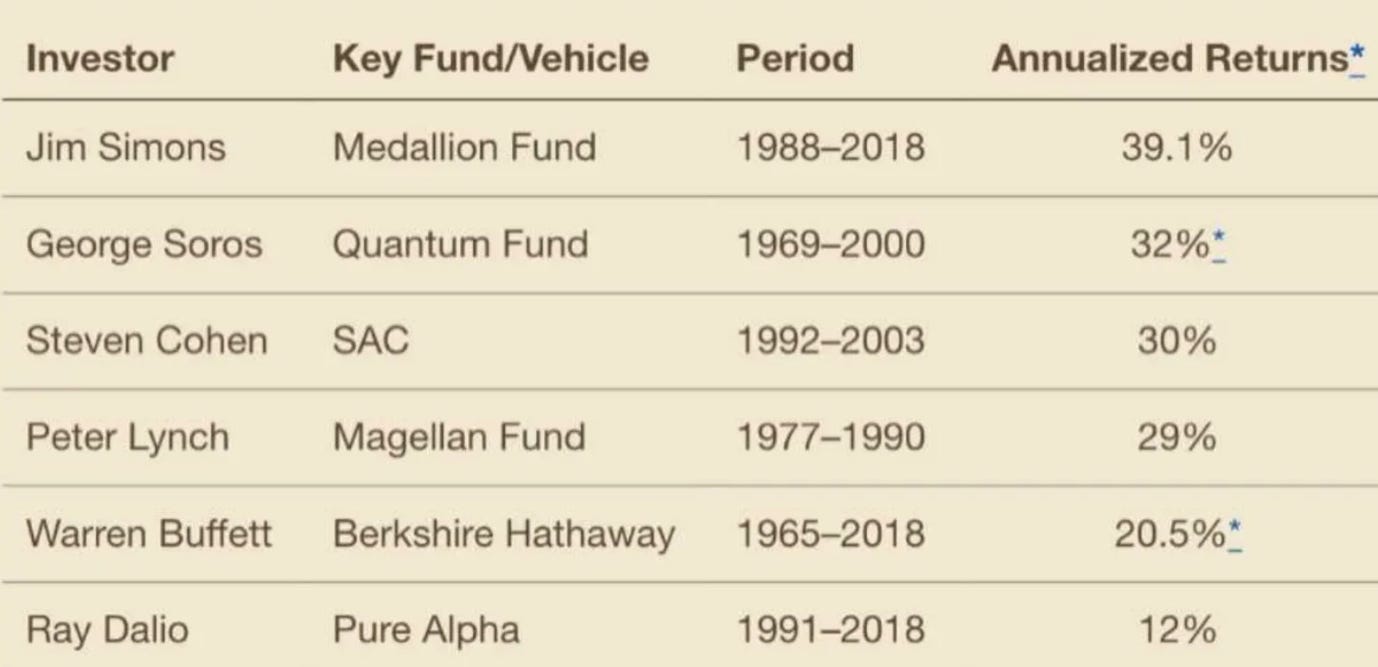
There are too many traders and investors who do not understand how impressive it is to create 20-30% annual returns consistently over a long period of time.
$10k would turn into $1 Million in just 21 years with a 25% annual return.
$10k invested every year would turn into $1 Million after just 13 years.
These are the returns Wall Street Legends generate.
Takeaway: Be realistic about what type of returns are possible over the long run.
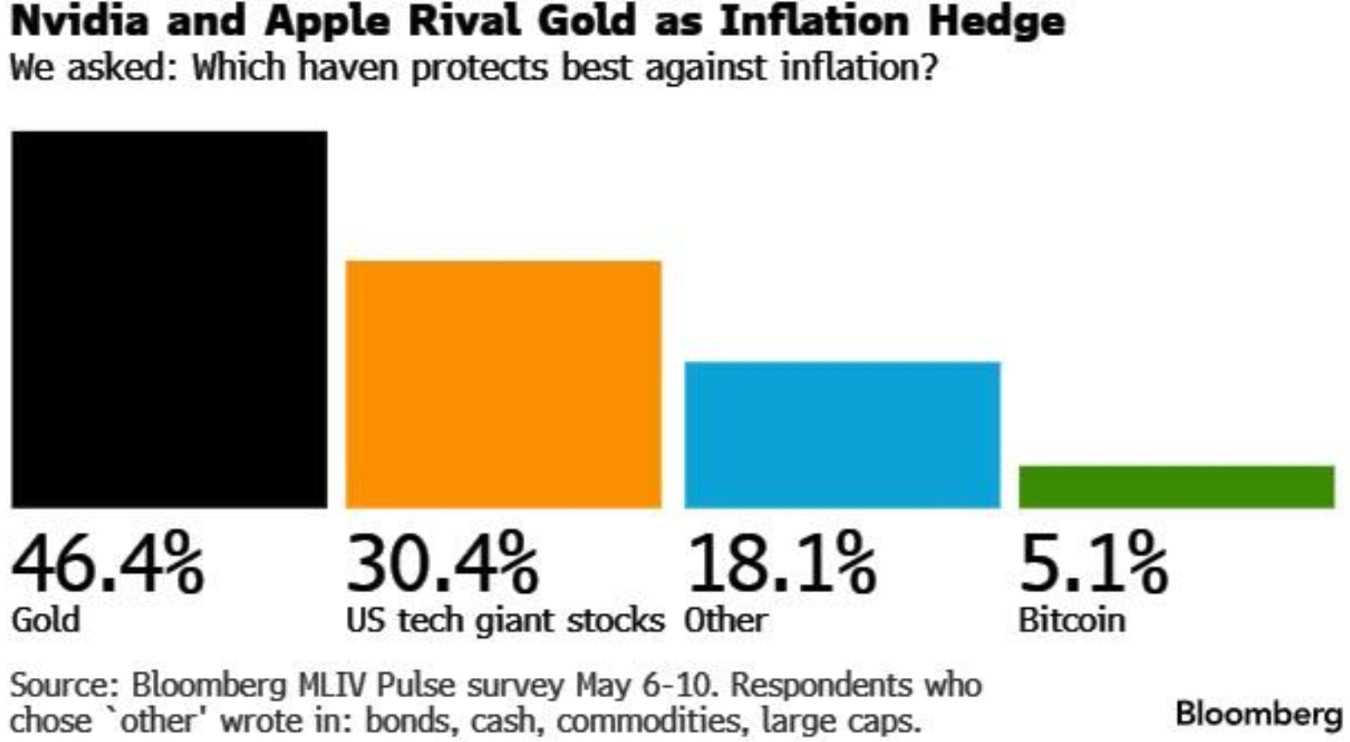
As a Bitcoin bull I love seeing data like this where it’s clear investors are still skeptical of Bitcoin despite the massive positive developments occurring within the industry.
The price appreciation isn’t too shabby either.
Takeaway: Bitcoin investors are still early.
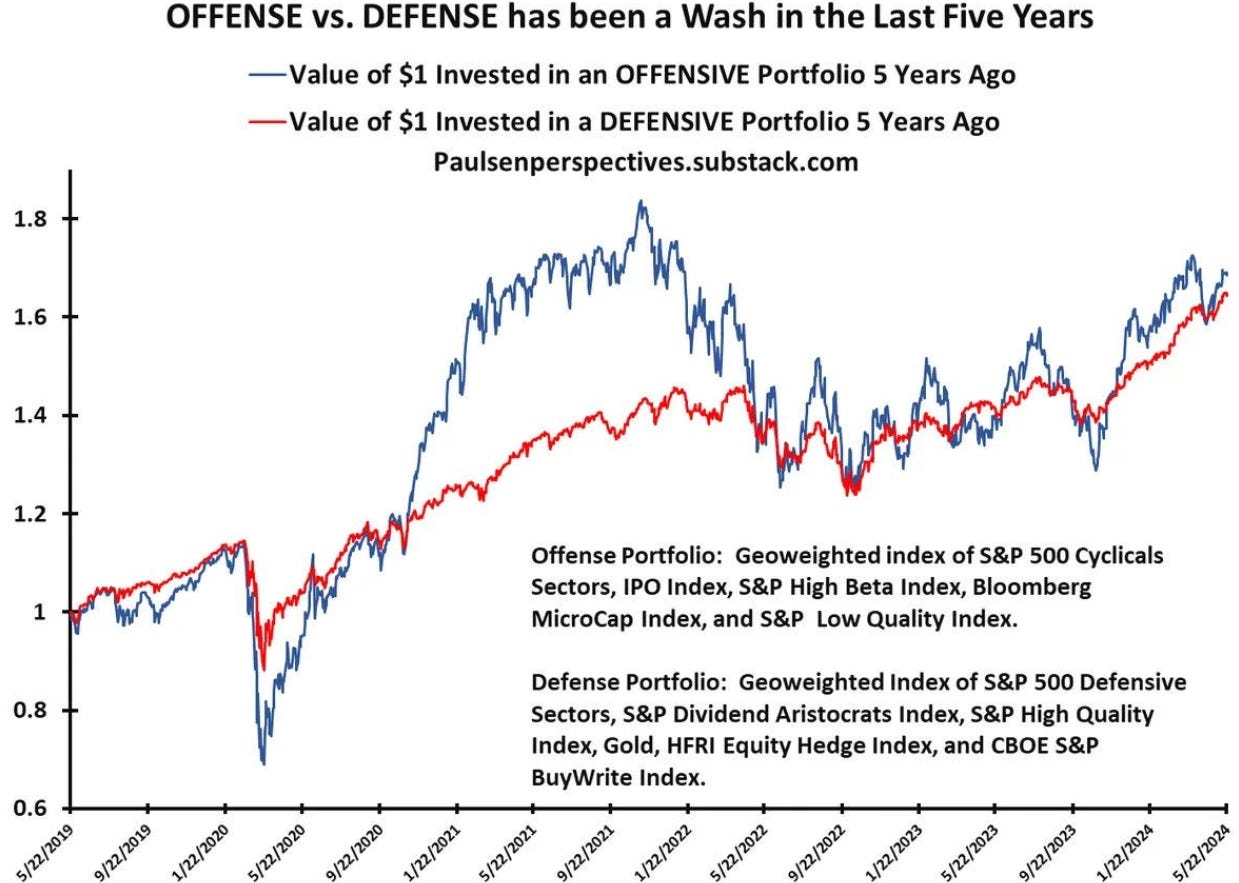
This is why markets are efficient, and most typically underperform a simple buy and hold strategy.
Edge in Financial Markets does not come from guessing on market direction (offense vs defense).
Takeaway: More sophistication is needed to extract edge in Financial Markets.
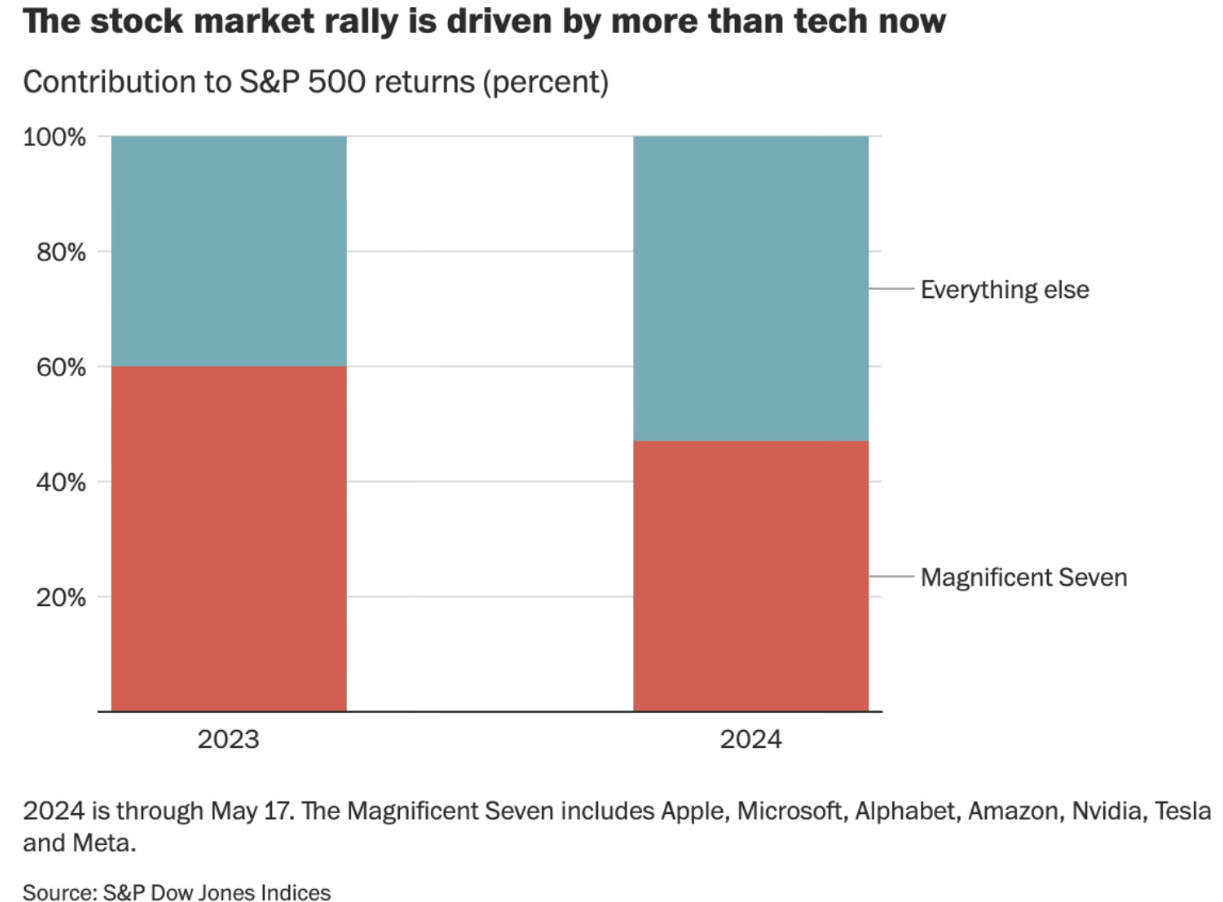
Permabears bang the table about how it’s just the Mag 7 holding the market up.
But the Mag 7 has slowed down. More stocks are participating, and the market continues to move higher.
What will permabears shout about next?
Takeaway: The stock market is showing signs of health that the bears were complaining wasn’t there last year.
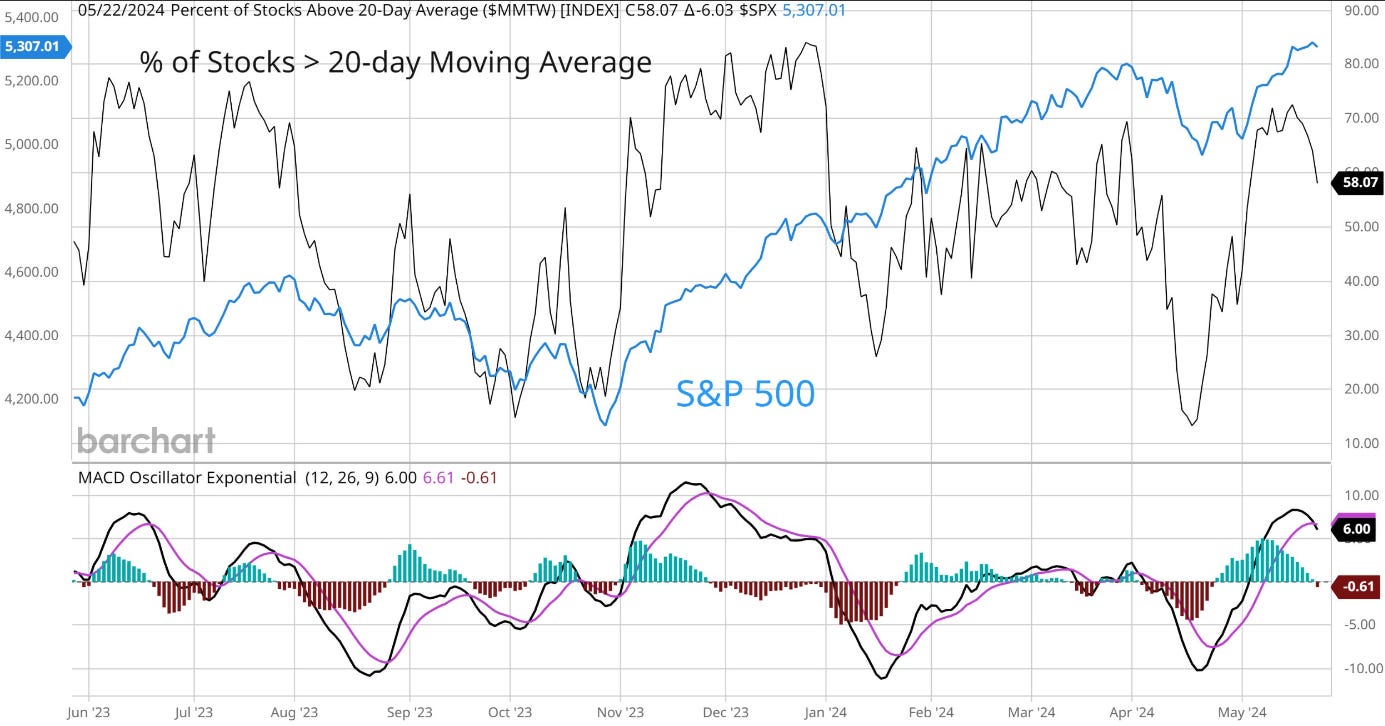
Interesting chart showing how the percentage of stocks above their 20 day moving average is decreasing.
It sounds like bad news on the surface.
But it’s also clear to see there’s little correlation between a deceleration in this metric and a market pullback.
It’s more 50/50.
Takeaway: We need more than one metric to make decisions in Financial Markets.
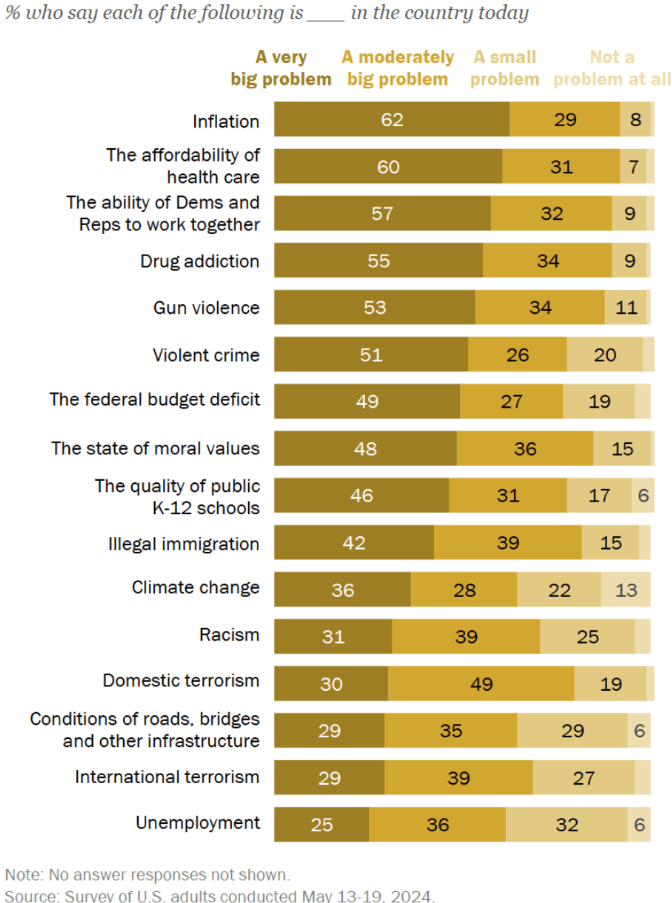
Am I the only one that thinks the Federal Budget Deficit should be higher on this list?
I also think if we fixed the Federal Budget Deficit it would help every category above it on the list, and most below it too.
Takeaway: We’ll probably continue to printing money and increasing government debt exponentially in the decades to come.
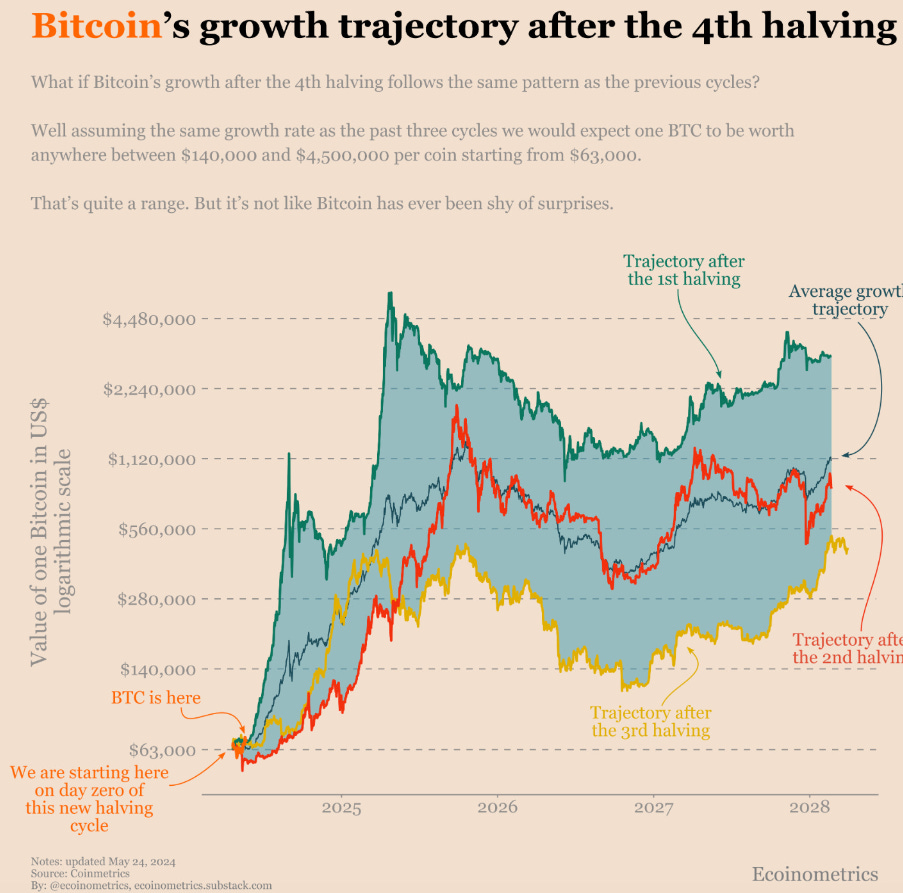
A chart showing the history of Bitcoin’s price returns each cycle after the halving.
Returns have diminished over the years but are still very healthy.
Takeaway: Bitcoin has historically risen exponentially in the 12-18 months after the halving.
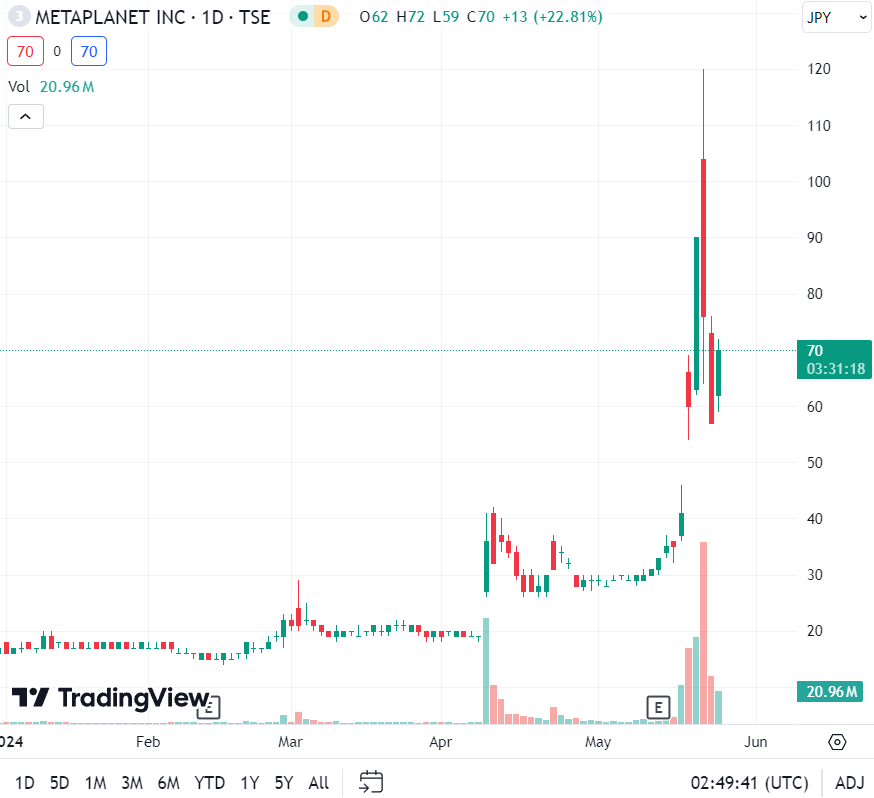
Metaplanet is a publicly traded company on the Tokyo Stock exchange who has undertaken a corporate Bitcoin strategy similar to that of MicroStrategy.
It’s up 200% since April 8th. Not even 2 months.
Takeaway: Michael Saylor and MicroStrategy were first. Only a matter of time until more companies follow along.
I hope you enjoyed reading Simply Finance. Please share this report with anyone that you think would benefit.
And don’t forget to subscribe so you don’t miss the next edition of Simply Finance!
Disclaimer: These are not recommendations. These are just my two cents, or two satoshis as the kids say. Remember to do your own homework before making any financial decisions. Also, keep in mind I might have some personal investments in the things I discuss.
"The economy and the markets are too complex for one data point to rule them all."
Man, I second that. Everyone would be rich in capital markets if they could base their investment decisions on a single metric.